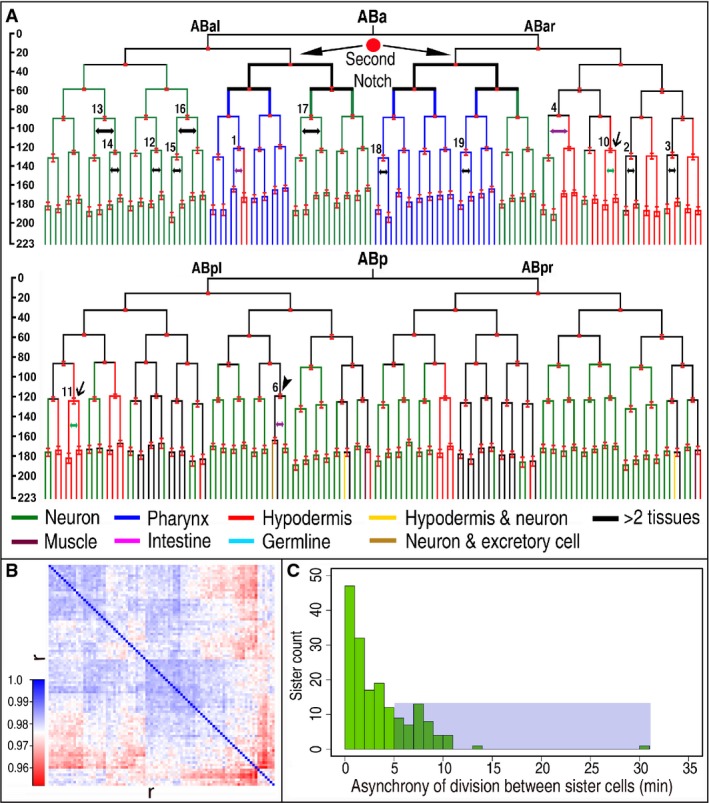
“ABa” (top) and “ABp” (bottom) cell lineage trees derived from average cell cycle lengths of 91 wild-type embryos of approximately 350-cell stage with standard deviations indicated as red bars on division nodes (see “P1” lineage tree in Supplementary Fig
S4A). Cell fates of “ABa” or “ABp” descendants are differentially color coded in a way similar to that in Fig
1 (note some fates are labeled with extra depth here that is not observed in Fig
1). Developing time in minutes is shown on the left starting from the last time point of “ABa” to the cutoff time point of 350-cell stage. Sister pairs used in screening for asynchrony are indicated with two-headed arrows that are color-coded in black, purple, and green to denote the following three types of division, respectively, that is, those giving rise to the same or different cell type(s) or one daughter to terminally differentiated cell and the other to a postembryonic blast cell (see also Fig
1C). Parent of the sister cells is labeled with a numerical code corresponding to that in Fig
5 below. Sublineages receiving Notch signaling (red dot) are indicated with two arrows and are highlighted in bold. Precursor of the excretory cell (ABplpapp) is indicated with an arrowhead. Precursor whose one daughter becomes terminally differentiated while the other develops into postembryonic blast cell is indicated with an arrow.

