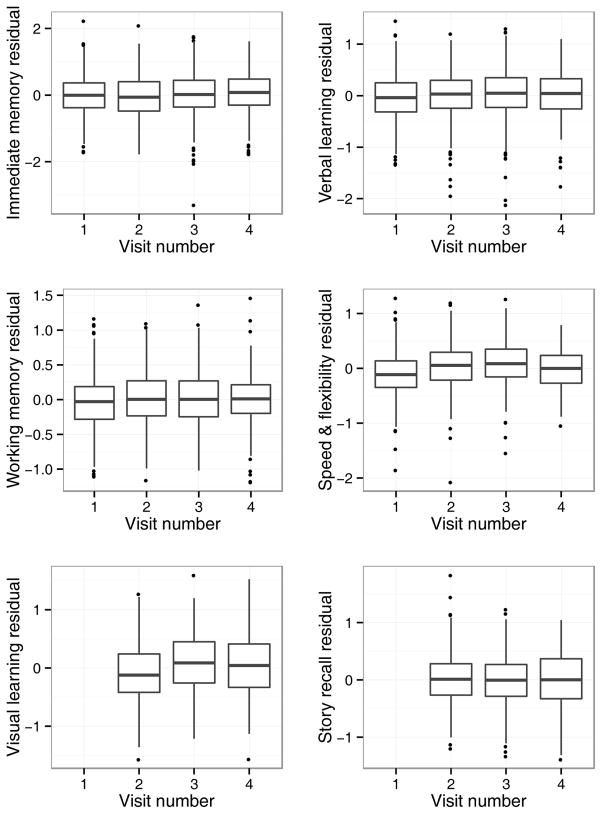
Figure 1.
Main effect of practice. To depict the practice effects for each factor score, we first obtained the factor score residuals at each visit, after adjusting for all model terms other than visit number, and created boxplots of these residuals. The center line of each boxplot in Figure 1 represents the estimated mean outcome at each visit. Factors with significant practice effects show center lines that increase across visits. Note: Visual Learning and Story Recall scores available starting at Visit 2.

