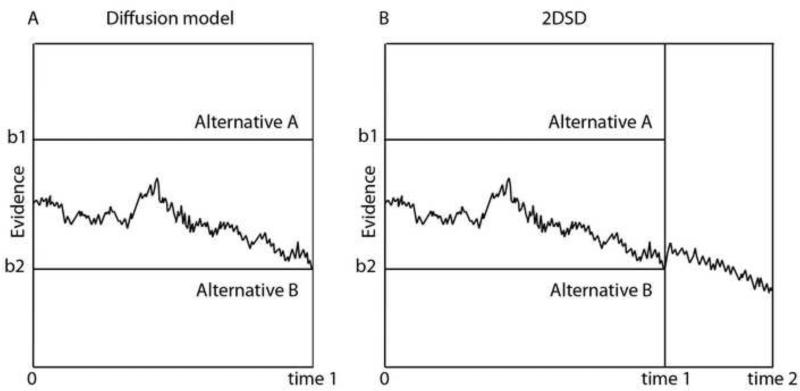
Figure 3.
Schematic representation of the diffusion (A) and 2DSD model (B). A. Diffusion model: The black jagged line depicts the accumulation process when the observer chooses alternative B. The boundaries (b1 and b2) are arbitrarily set by the observer as a decision criterion. B. 2DSD model. In this model the accumulation continues after the decision is taken to give a confidence judgment (time 2). Modified from (Pleskac and Busemeyer, 2010).

