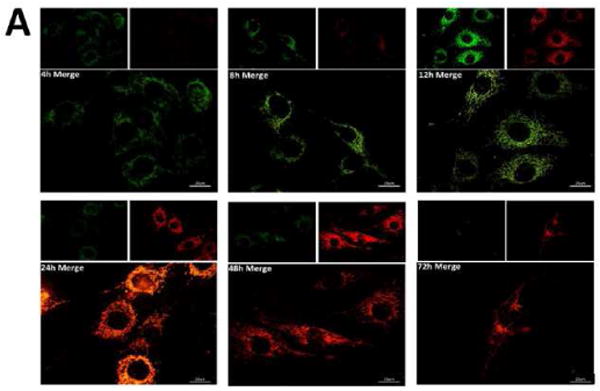
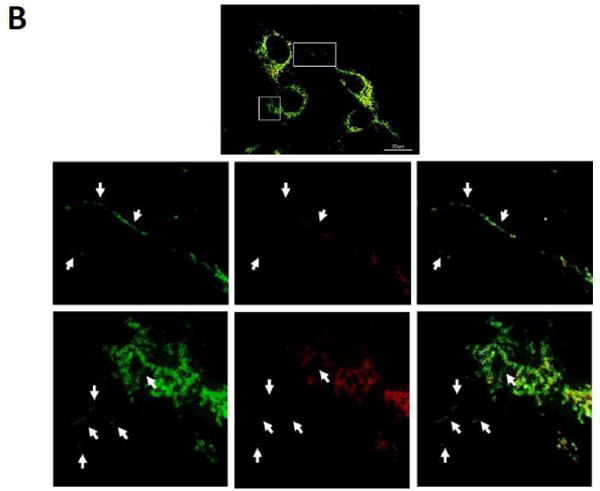
Figure 3. MitoTimer.


(A) C2C12 cells expressing Tet-inducible MitoTimer, exposed to Dox for 1 h, and then imaged at 4, 8, 12, 24, 48 and 72 h. Merged images of green and red channels are shown; smaller insets show the expression levels of MitoTimer green and MitoTimer red fluorescence. (B) Heterogeneous expression of MitoTimer fluorescence, indicating mitochondria with differential rates of import.
