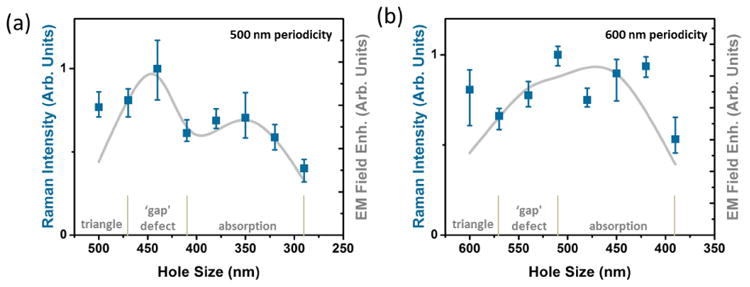
Figure 5. Origin of EM field enhancement.

The combined EM field enhancement for the ordered and defective EM field enhancement mechanisms are compared to the measured Raman response for a (a) 500 nm periodicity and (b) a 600 nm periodicity pattern as the hole size is varied. The region where each contribution dominates is shown, with the ‘gap’ defects enhancing over a range given by the formation of gaps between nanoholes in the transition from triangles, the ordered pattern contribution corresponding to the peak absorption when there are only nanoholes. The range where only nanotriangles exist is shown for comparison.
