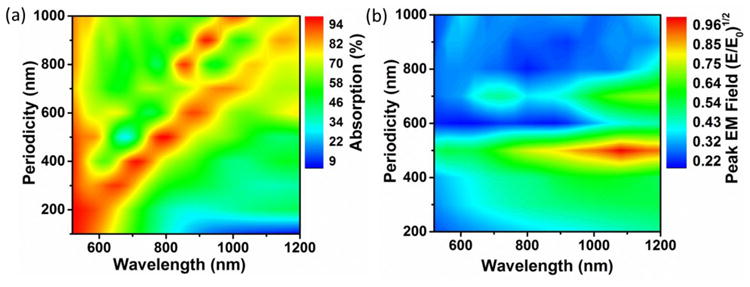
Figure 6. Optimization of pattern for SERS.

(a) The absorption peak position for a fixed hole to periodicity ratio of 0.7 at which the ordered EM field contribution was found to be maximal. The peak EM field is slightly red shifted from the absorption peak position. (b) The ‘gap’ defect EM field enhancement peaks for a periodicity of 400∼500 nm and a hole size of ∼40-80 nm less than the periodicity. These two curves can be used independently, or in combination, to find the best patterning parameters for a given excitation or Raman peak.
