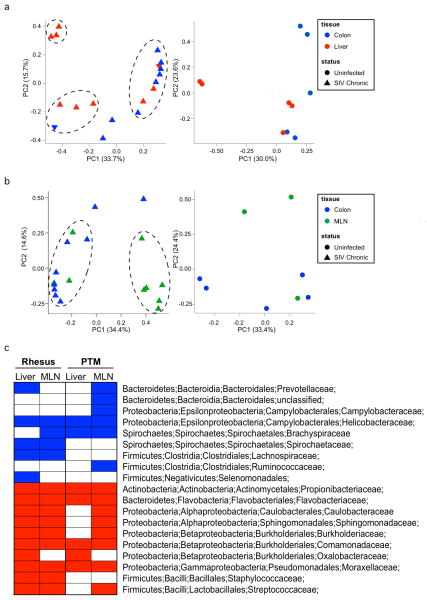
Figure 6. Specific families of proteobacteria translocate from the gut.
DNA extracted from the colon, liver and MLN of uninfected and experimentally SIV-infected RM was amplified using bacterial 16S primers tagged for 454 pyro-sequencing analysis. a) Principal component analysis showing differences in the bacterial communities of the colon (blue) and liver (red) in SIV-infected (left panel) and uninfected (right panel) animals. b) Principal component analysis showing differences in the bacterial communities of the colon (blue) and MLN (green) in SIV-infected (left panel) and uninfected (right panel) animals. c) Metastats analysis was performed to determine which bacteria were present at significantly different abundance in either the liver or MLN compared to the colon of all RM or PTM used in the study. The graph shows bacterial families that are significantly under represented (blue) or over represented (red) in the tissues of each animal group.

