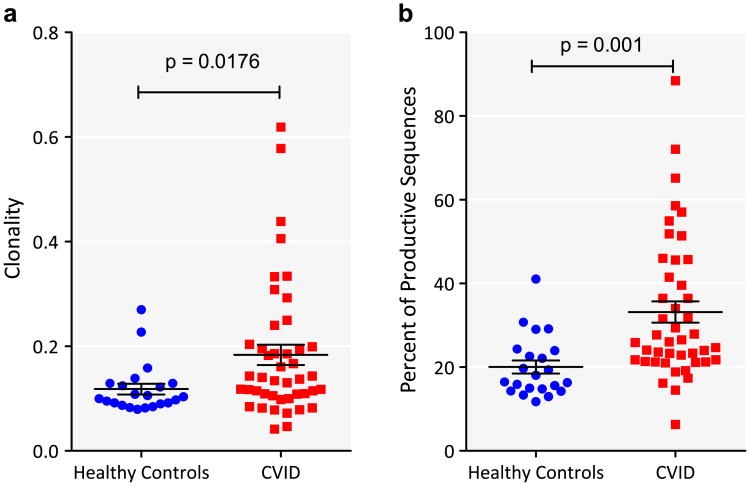
Figure 3.
CVID TCR sequences have increased clonality compared to healthy controls. a) Clonality of CVID (red square) and control DNA (blue filled circle) is shown. Horizontal line represents mean and whiskers represent standard error of mean. The groups were compared by t-test and the p-value is indicated. b) All productive clones were ranked by their normalized copy number. The sum of the copy numbers of the top 1% of clones was calculated. The figure depicts the sum of the copy number as a percent of the normalized copy number of all productive sequences on the y-axis and group on the x-axis (CVID – red square; controls – blue filled circle). The groups were compared by t-test and the p-value is indicated. (For interpretation of the references to color in this figure legend, the reader is referred to the web version of this article.)

