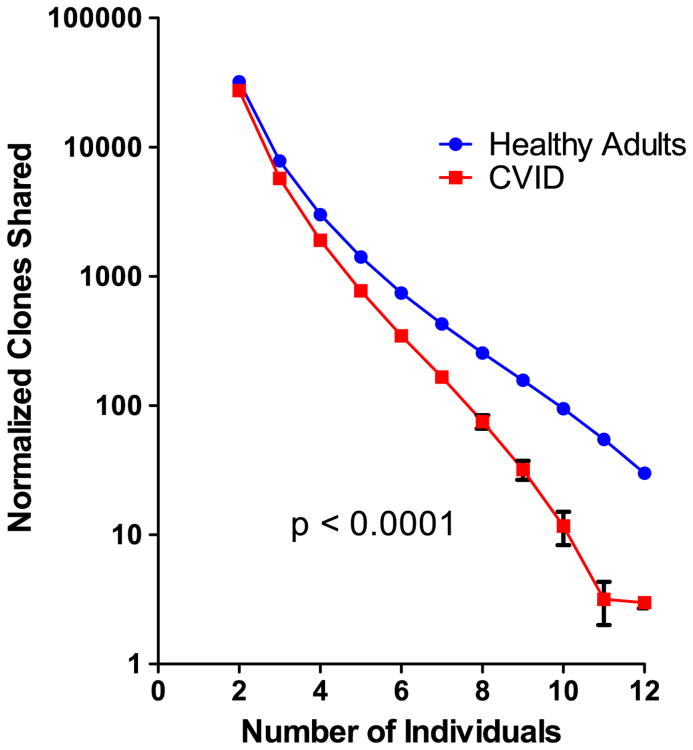
Figure 5.
CVID TCR sequences share fewer clones compared to normal controls. CVID and control DNA were iteratively sampled, 12 individuals at a time for 100 repeats. The amino acid sequences of CDR3 regions of productive clones were compared separately amongst CVID patients (red squares) or healthy controls (blue filled circles). The number of individuals that share each clone in a sample of DNA was determined. The mean number of clones shared amongst 2 to 12 individuals was then determined. The number of individuals who share a clone is designated on the x-axis. The mean number of clones shared amongst patients or controls is depicted on the y-axis on a log10 scale. Error bars represent the 95% confidence interval. Kolmogorov–Smirnov test p-values are indicated. (For interpretation of the references to color in this figure legend, the reader is referred to the web version of this article.)

