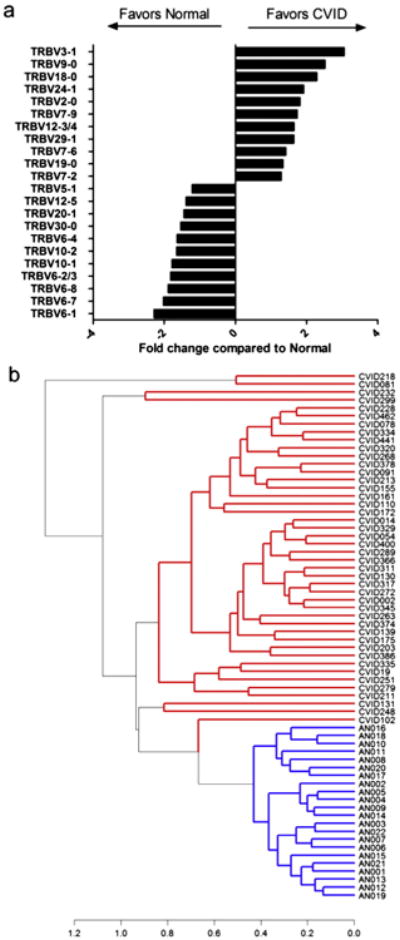
Figure 6.

CVID DNA contains divergent Vβ families as compared to control DNA. a) The average fraction of sequences utilizing each V gene was calculated for CVID patients and controls. Ratios of CVID:normal were determined for V genes where significant differences were present. Ratios less than 1 are depicted as their negative reciprocal for ease of comparison. b) Non-biased clustering of scaled V gene distribution for the 42 CVID and 22 control subjects was performed using Manhattan distance and complete clustering algorithms. CVID DNA samples, shown in red, are completely segregated from control DNA, shown in blue. Clustering distance is indicated on the x-axis. Sample numbers are indicated on the right prefaced by CVID or AN (adult normal) for controls. (For interpretation of the references to color in this figure legend, the reader is referred to the web version of this article.)
