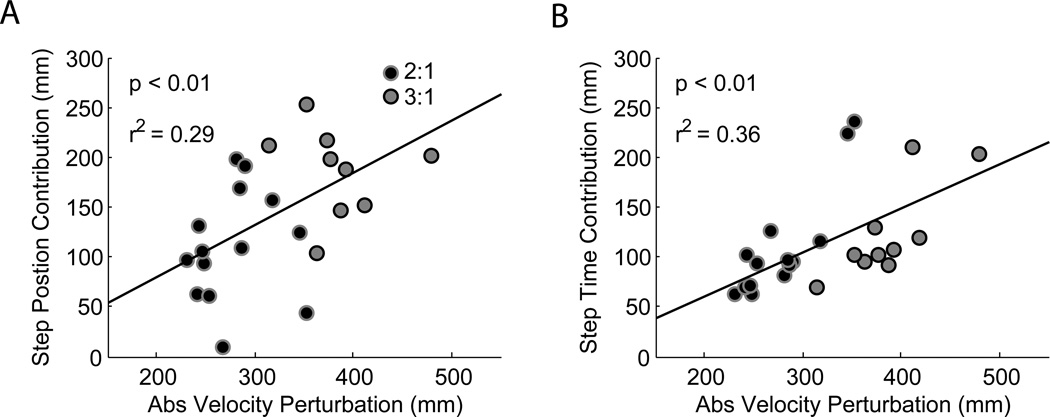
Figure 4.
Step position and step time contributions as a function of velocity perturbation magnitude. In each plot, black dots with gray outlines represent data from participants who walked at a 2:1 belt speed ratio and gray circles with black outlines represent data from participants who walked at a 3:1 ratio. Both the a) step position and b) step time contributions increased proportionally with the magnitude of the velocity perturbation.

