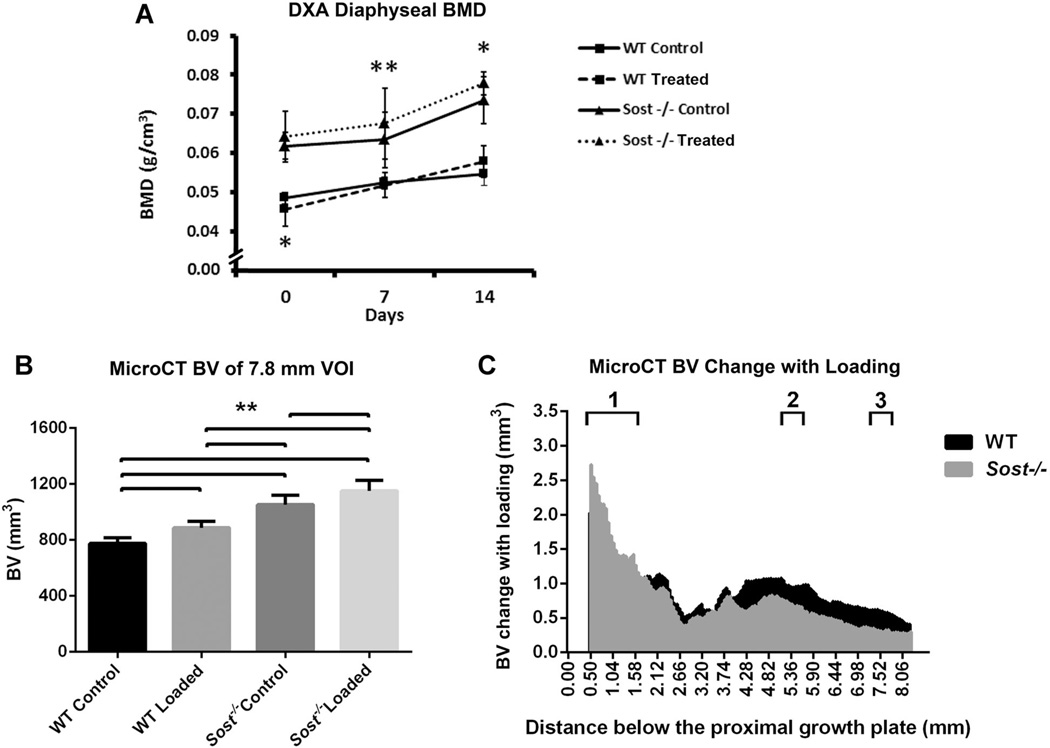
Fig. 6.
Control and load-matched (−9.0N) loaded tibiae of WT (wild type) and Sost−/− mice: (A) DXA measured mean bone mineral (BMD) of the tibial diaphysis at days 0, 7, and 14. Bars represent ± SD; (B) MicroCT measured mean bone volume, within the 7.8 mm VOI of the tibiae. Bars represent + SD; (C) Bone volume change between loaded and control tibiae along the 7.8 mm VOI. 1–3. Localities of sub-regional VOIs: 1. Metaphyseal VOI, 2. 37% Cortical VOI, 3. 50% Cortical VOI. **p < 0.01, *p < 0.05.

