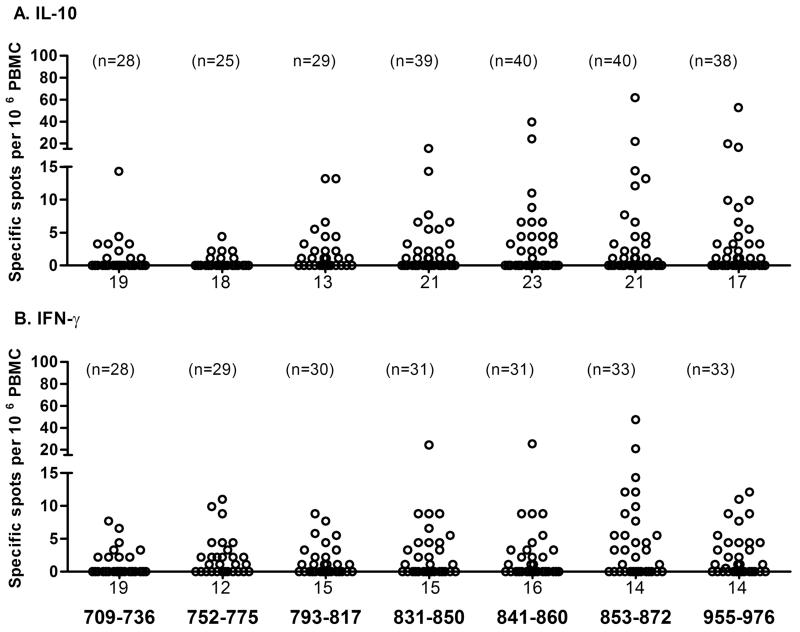
FIGURE 2.
T-cell responses to IA-2 peptides. The number of responding cells per million PBMC detected in ELISPOT assays and representing cells responding to each IA-2 peptide tested are presented as scatter plots for IL-10 (A) and IFN-γ (B). The numbers of patients tested for each peptide are indicated above the relevant scatter plot and the number of zero values for each peptide below the plot.

