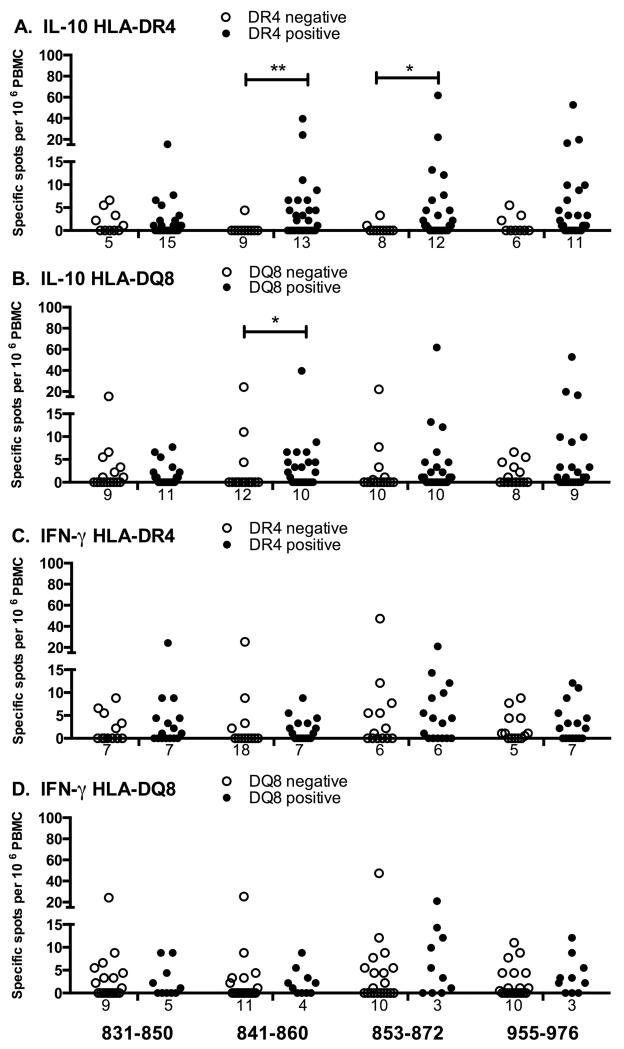
FIGURE 3.
Association of T-cell responses with HLA. Type 1 diabetic patients analysed for T-cell responses to IA-2 peptides by IL-10 (A, B) or IFN-γ (C, D) ELISPOT were grouped according to the expression of HLA-DR4 (A, C) or HLA-DQ8 (B, D). T-cell responses of patients expressing (black bars), or not expressing (open bars) the relevant HLA allele are presented as scatter plots, with numbers of zero values indicated below each plot. Data were analysed for differences in T-cell responses to peptides using Lachenbruch’s 2-part model, that assesses differences in both proportions of responders and magnitude of responses; * p<0.05, **p<0.01.

