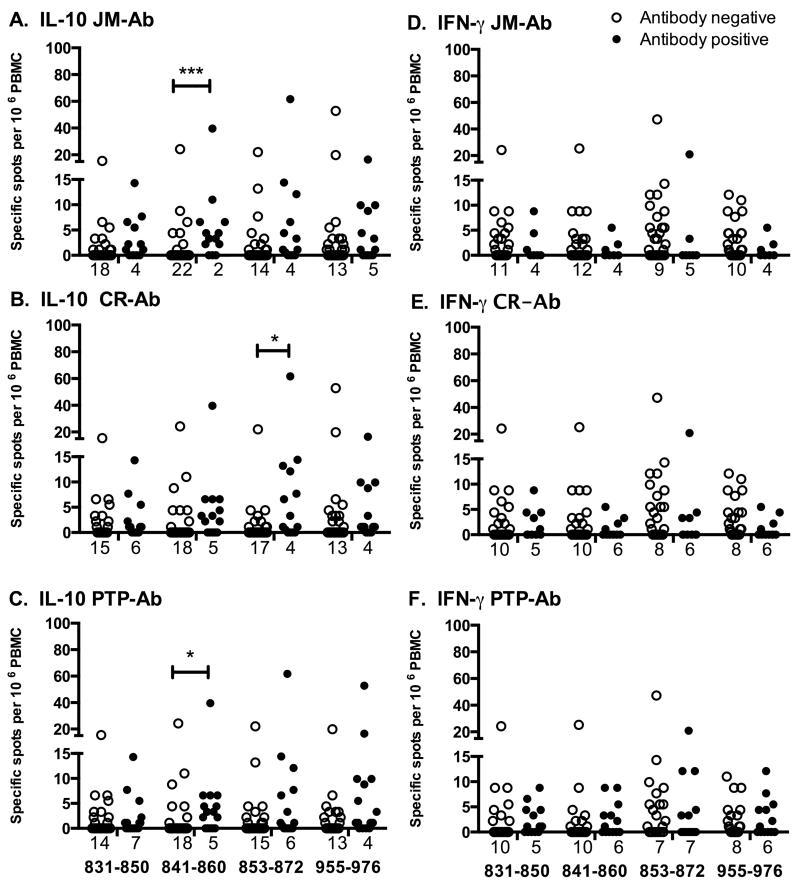
FIGURE 4.
Association of T-cell responses with IA-2-related antibodies. Type 1 diabetic patients analysed for T-cell responses to IA-2 peptides by IL-10 (A-C) or IFN-γ (D-F) ELISPOT were grouped according to the presence or absence of antibodies to the JM domain (A, D), the central region of the IA-2 PTP domain (B, E) or the entire PTP domain (C, F). T-cell responses to peptides 831-850, 841-860, 853-872 and 955-976 in antibody negative (open bars), or positive (black bars) patients are presented as scatter plots, with numbers of zero values indicated under each plot. T-cell responses to other peptides were not associated with autoantibodies. Data were analysed for differences in T-cell responses to peptides using Lachenbruch’s 2-part model; * p<0.05, ***p<0.001.

