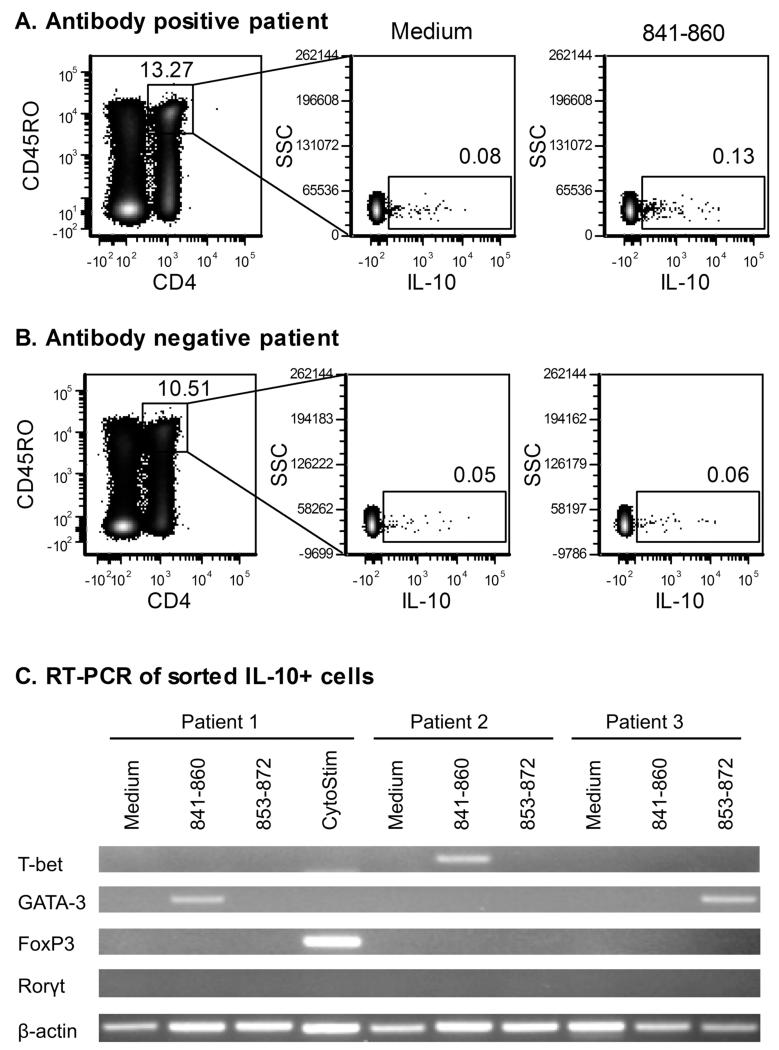
FIGURE 5.
Phenotype of autoantigen-specific IL-10 T-cells. Following overnight stimulation with medium alone, IA-2 peptide or CytoStim, IL-10 secreting cells were labelled using the IL-10 secretion assay detection kit (Miltenyi Biotec) and co-stained with a live/dead cell dye and antibodies to CD4 and CD45RO. Dot plots showing IL-10 secreting, CD4+, CD45RO+ T-cells detected after incubation with medium or 841-860 peptide for an antibody positive (A) and antibody negative (B) patient are shown. Percentages of cells within each of the gates are indicated on the plots. Live CD4+ CD45ROhi cells were flow sorted and analysed by RT-PCR for expression of transcription factors associated with differentiation of distinct T-cell subsets. PCR products were visualized on a 3% agarose gel to provide information on the phenotype of IL-10 secreting T-cells for each of the experimental conditions (C).

