
FIG 1 .
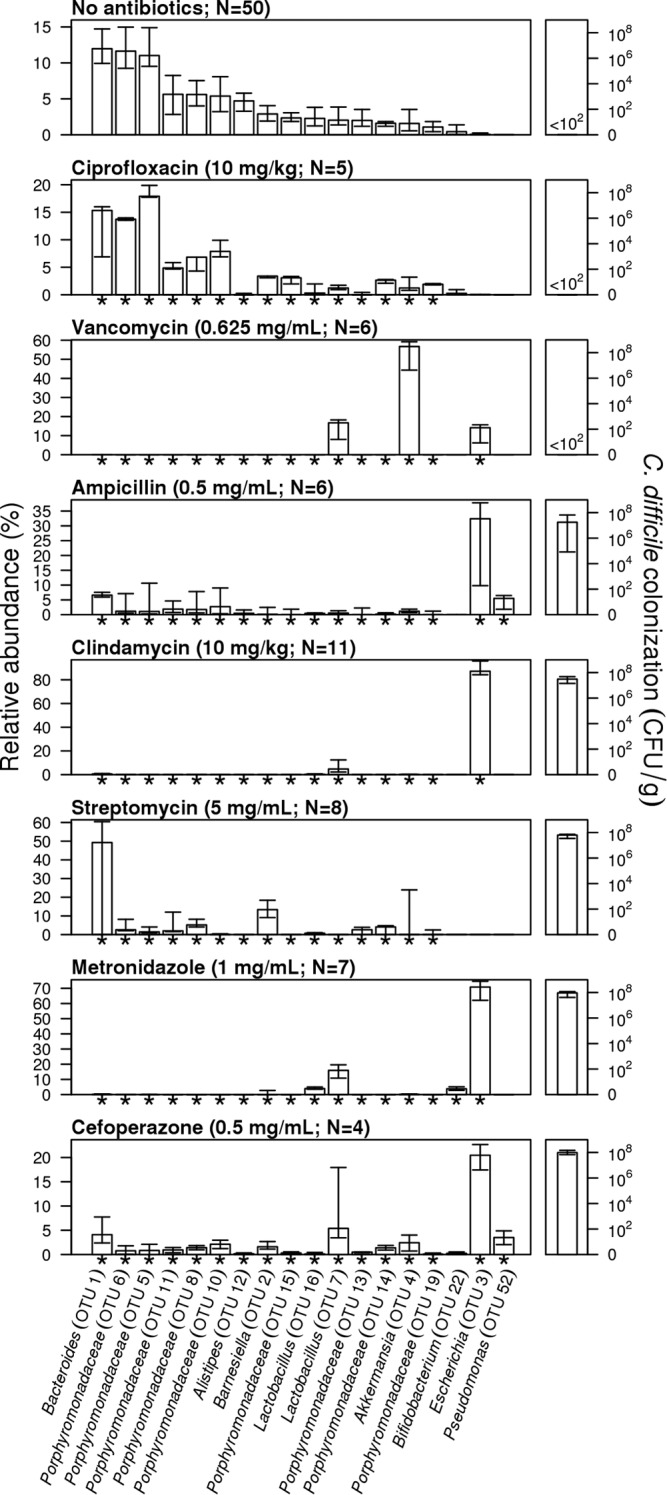
Antibiotic treatments result in significant alterations to the structure of the microbiota and variation in colonization resistance. Bars indicate the median percent relative abundance of those selected OTUs from all treatment groups on the day of C. difficile challenge. Asterisks along the x axis indicate those OTUs that were significantly different from untreated mice for that antibiotic treatment after correcting for multiple comparisons. The error bars indicate the interquartile range. The median level C. difficile colonization found 24 h after microbiota sampling is plotted on the right for each treatment, with error bars indicating the interquartile range. The dose of antibiotic and the number of animals used in each treatment group are indicated for each antibiotic treatment group. The treatment groups are shown in order of the level of C. difficile colonization.