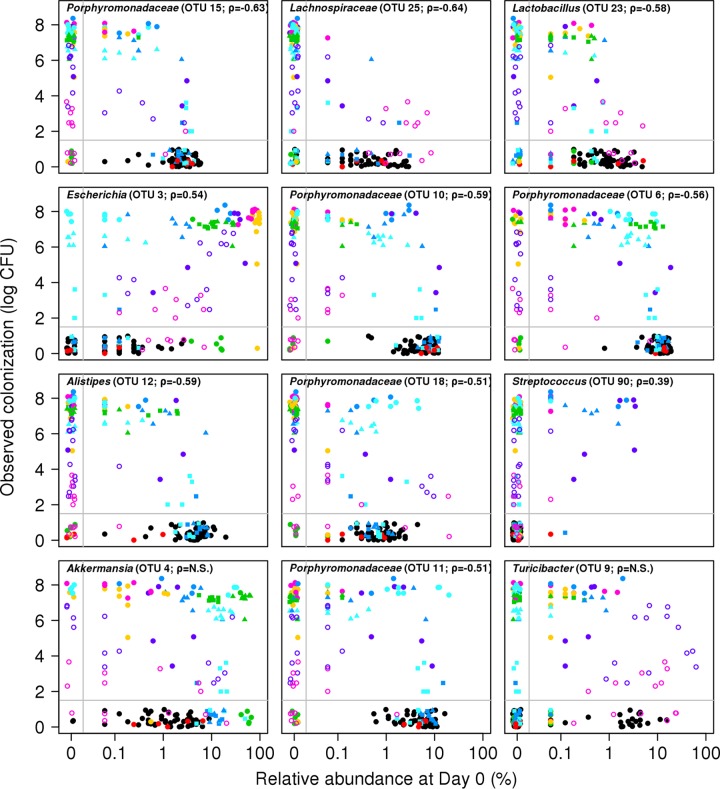
FIG 6 .
Relationship between OTU relative abundance and C. difficile colonization levels indicates nonlinearity and context dependency. The 12 OTUs that resulted in the greatest change in percent mean squared error when removed from the random forest regression model are shown in each panel and together explain 77.1% of the variation in the data. The Spearman correlation value between that OTU’s abundance and C. difficile levels are shown for each panel when the corrected P value was significant. The color and symbols represent the same antibiotic dose and recovery period as in Fig. 5. N.S., not significant.

