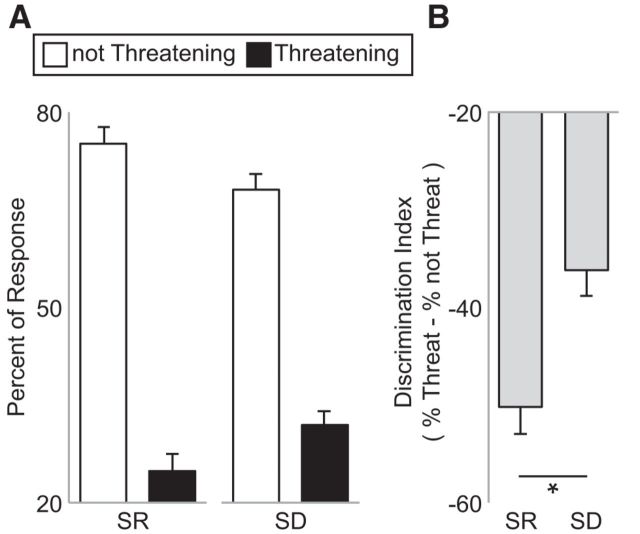
Figure 2.
Behavioral results. A, Mean proportion of stimuli categorized as either threatening or not threatening in the sleep-rested (SR) and sleep-deprived (SD) conditions. B, Corresponding change in response tendency characterized as a threat discrimination index represented as the subtracted difference in the proportion of not threatening items relative to the portion of threatening items in the SR and SD conditions. A zero value represents equal number of stimuli assigned to threatening and not threatening categories, whereas a positive score represents a greater proportion of stimuli as rated as threatening relative to not threatening. A paired t test demonstrated a significant increase in the proportion of faces rated as threatening in the SD condition compared with the SR condition (t = 2.36, p = 0.03). Error bars indicate SEM. *p < 0.05.

