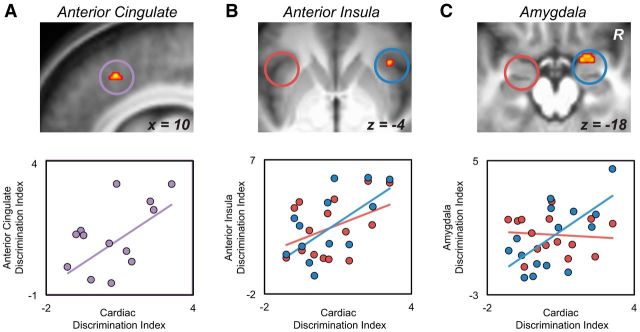
Figure 5.
A, Brain maps displaying the voxelwise ROI regression between the cardiac discrimination index and the sleep-rested dACC discrimination ability (threatening > not threatening contrast; peak MNI coordinates: 10, 22, 44 thresholded at FWE p < 0.05 corrected for multiple comparisons). Scatterplot on far right displays this same relationship using the average parameter estimates across the 5 mm dorsal anterior cingulate ROI mask. Equivalent brain maps and regression plots for the anterior insula (B; peak MNI coordinates: right: 38, 24, −4) and amygdala (C; peak MNI coordinates: 18, 2, −16) ROIs. No significant relationships were found for the left amygdala (r = −0.09, p = 0.75) or the left anterior insula (r = 0.42, p = 0.12).

