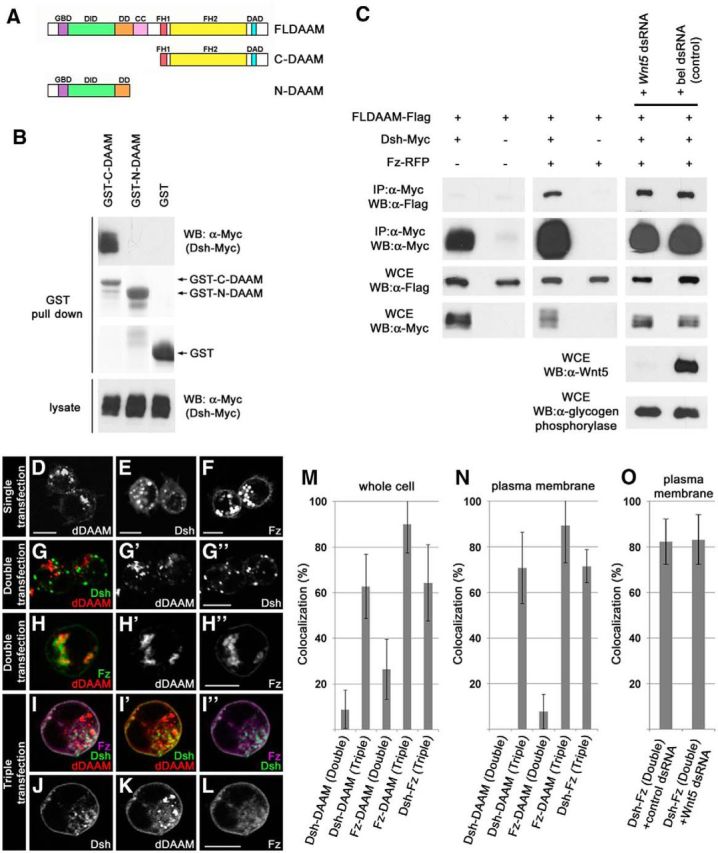
Figure 6.

Fz promotes the formation of membrane-associated Dsh-dDAAM complexes. A, The structure of the wild-type dDAAM protein and the truncated C-DAAM and N-DAAM isoforms used during our GST pull-down experiments. B, GST pull-down assay with truncated dDAAM isoforms. C-DAAM pulled down Dsh-Myc from S2 cell lysates, whereas N-DAAM did not. C, Coimmunoprecipitation experiment with dDAAM-Flag and Dsh-Myc double transfected, or dDAAM-Flag, Dsh-Myc, and Fz-RFP triple transfected S2 cells. dDAAM-Flag was coprecipitated with Dsh-Myc only in the presence of Fz-RFP, and this interaction is independent of the presence of Wnt5 (silencing with the bel dsRNA was used as a control; α-glycogen phosphorylase was used as loading control). WB, Western blot; WCE, whole-cell extract. D–L, S2 cells transfected with dDAAM-HA (D), Dsh-GFP (E), or Fz-Myc (F) alone, or cotransfected with dDAAM and Dsh (G–G″), dDAAM and Fz (H–H″), or triple transfected with dDAAM, Dsh, and Fz (I–L). In the case of single transfections, stained for the corresponding protein tag, dDAAM-HA (D) and Dsh-GFP (E) localize mostly in the cytoplasm, whereas Fz-Myc (F) displays a cytoplasmic and a plasma membrane accumulation as well. In the double transfected cells, neither Dsh nor Fz shows strong colocalization with dDAAM (G–H″). By contrast, in triple transfected cells, beyond a partial cytoplasmic accumulation, all three proteins show a membrane accumulation and a strong colocalization with each other (I–I″). J–L, Individual channels of a triple transfected cell. M, N, Quantification of the colocalization between Dsh, dDAAM, and Fz (in the pairwise combinations indicated) in the whole cell (M) or at the plasma membrane (N) in double (Dsh-DAAM or Fz-DAAM) or triple (Dsh-DAAM-Fz) transfected S2 cells. O, Quantification of the colocalization between Dsh and Fz at the plasma membrane in the presence of a control dsRNA, and the Wnt5 dsRNA that strongly reduces the Wnt5 protein level (see also C). M–O, Error bars indicate the SD. Scale bars, 10 μm.
