Figure 9.
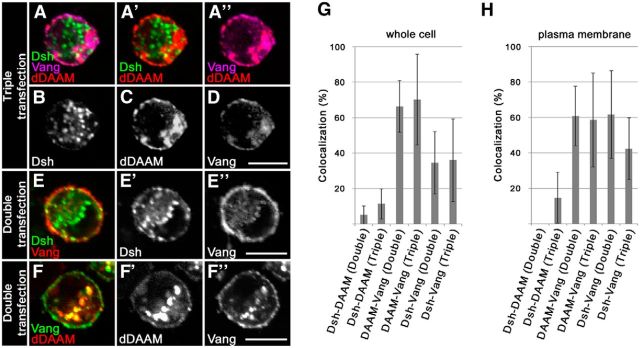
The colocalization of Vang and dDAAM in S2 cells. A–F″, Confocal images of S2 cells triple transfected with Vang-Flag, dDAAM-HA, and Dsh-GFP (A–D) or cotransfected with Vang-Flag and Dsh-GFP (E–E″) or Vang-Flag and dDAAM-HA (F–F″). Vang was detected with anti-Flag, dDAAM with anti-HA, and Dsh with anti-GFP staining. A–D, In triple transfected cells, the presence of Vang (magenta) does not enhance the colocalization between Dsh (green) and dDAAM (red) (A′), but dDAAM and Vang colocalize strongly (A″). B–D, The corresponding individual channels for a triple transfected cell. E–E″, In double transfected cells, Vang (red) displays a partial colocalization with Dsh (green) that is stronger at the plasma membrane than in the cytoplasm. The corresponding individual channels are shown in E′, E″ in grayscale. F–F″, Similar to triple transfected cells, dDAAM (red) shows a strong colocalization with Vang (green) in double transfected cells as well, both at the plasma membrane and in the cytoplasm. The corresponding individual channels are shown in F′, F″ in grayscale. G, H, Quantification of the colocalization between Vang, dDAAM, and Dsh (in the pairwise combinations indicated) in the whole cell (G) or at the plasma membrane (H) in double (Dsh-DAAM, Vang-DAAM, or Vang-Dsh) or triple (Dsh-DAAM-Vang) transfected S2 cells. G, H, Error bars indicate the SD. Scale bars, 10 μm.

