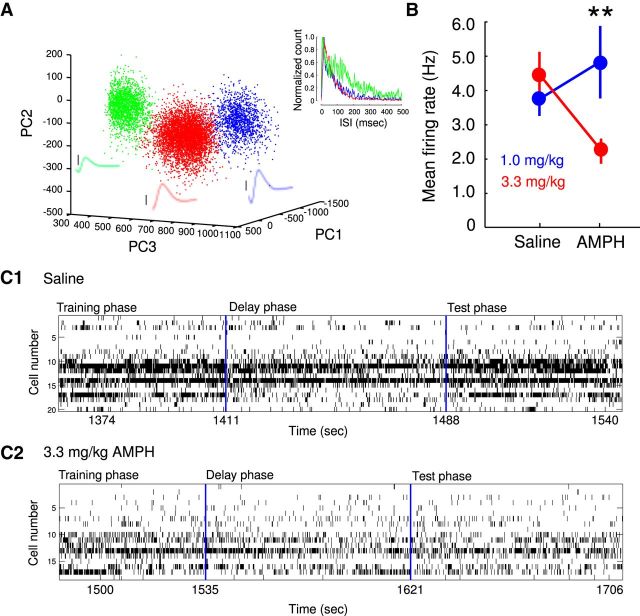
Figure 2.
Effects of AMPH on neural firing. A, A representative scatter plot from a single electrode, in which three different single units were isolated via spike sorting. The mean waveform corresponding to each color-coded cluster are shown in the scatter plot. Black scale bars next to each waveform, 50 μV. The inset shows the color-coded interspike interval (ISI) distribution corresponding to each unit. B, Changes in overall average iFR ± SEM in the DSWSh task as a function of AMPH concentration. Representative examples of iFRs for all units throughout performance of the DSWSh task for a SAL-treated (C1) and a 3.3 mg/kg AMPH-treated (C2) animal. Note the general decrease in firing rate across the task after 3.3 mg/kg AMPH. **p < 0.01, ANOVA, treatment × dose interaction.

