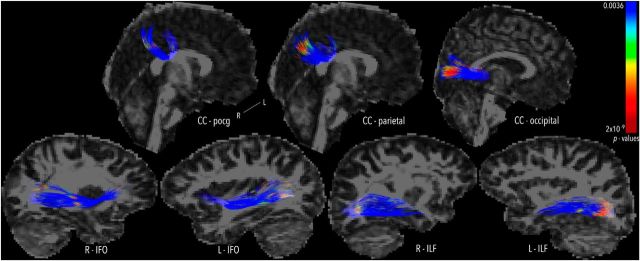
Figure 2.
Differences between IHTT-slow and control groups in MD. Whole-tract differences in MD between IHTT-slow and control groups. The p values are shown corresponding to the color bar, and results were FDR corrected across all points on all tracts tested (q < 0.05; critical p threshold = 0.0036). For simplicity, only tracts with at least 5% of the tract showing significant differences are displayed.

