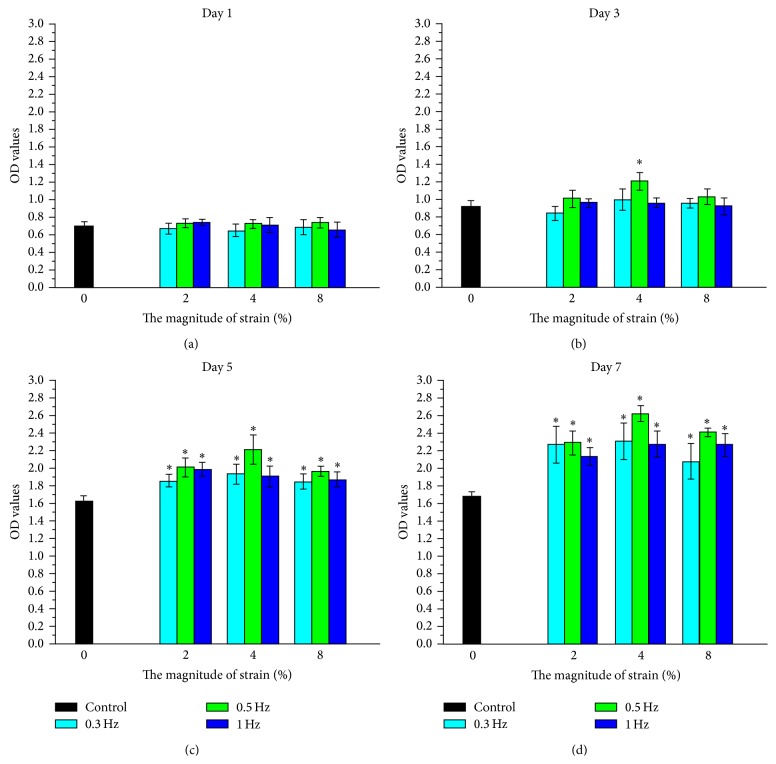
Figure 2.
WST-1 results of TDSCs cultured in control group and different experimental groups (1 d for (a); 3 d for (b); 5 d for (c); 7 d for (d)). The data were expressed as mean ± SD. The samples indicated with asterisk (∗) had a significant difference between experimental groups and control group (P < 0.05) (n = 3).

