Figure 4.

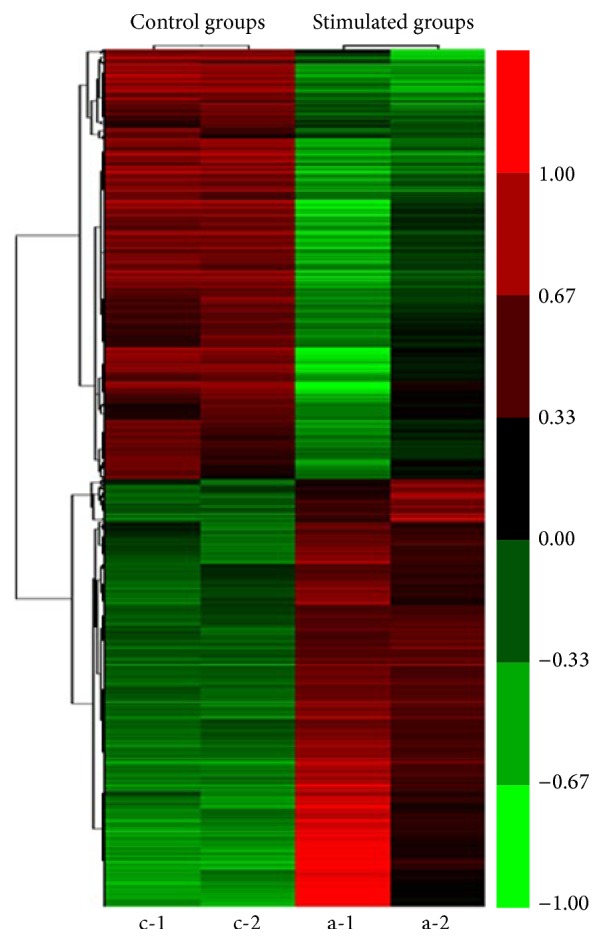
Transcriptome microarray analysis of TDSCs in the stimulated groups (a-1 and a-2) and control groups (c-1 and c-2), calculated with cluster 3.0.

Transcriptome microarray analysis of TDSCs in the stimulated groups (a-1 and a-2) and control groups (c-1 and c-2), calculated with cluster 3.0.