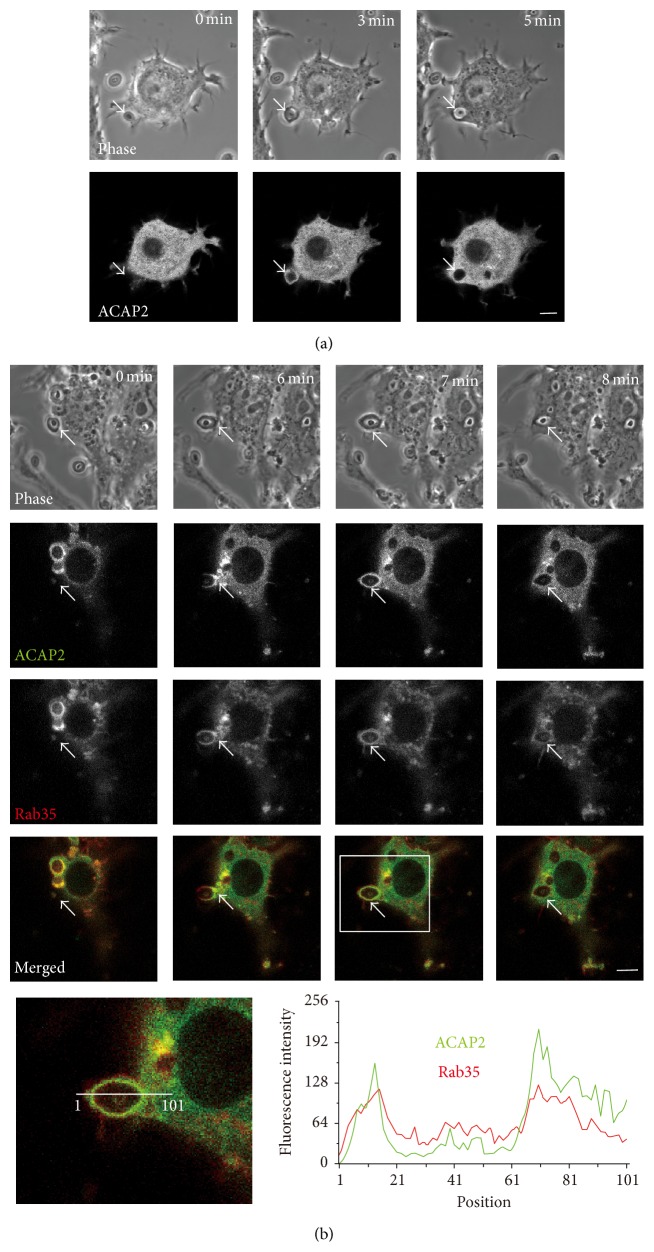
Figure 4.
Live-cell imaging of GFP-ACAP2 and Rab35 in RAW264 macrophages during phagocytosis of zymosan. (a) RAW264 cells expressing GFP-ACAP2 were allowed to make contact with zymosan (arrows) and were observed by confocal laser microscopy. Phase-contrast images are shown (top panels). The elapsed time is indicated at the top. The binding of zymosan to the cell surface was set as time 0. Scale bar: 5 μm. (b) Live RAW264 macrophages coexpressing GFP-ACAP2 and TagRFP-Rab35 were incubated with zymosan and were monitored by confocal microscopy. Scale bar: 5 μm. Boxed area is enlarged (bottom left). Line scan analysis using MetaMorph program shows fluorescence intensities of GFP-ACAP2 (green) and TagRFP-Rab35 (red) at the position of the line in the enlarged image.

