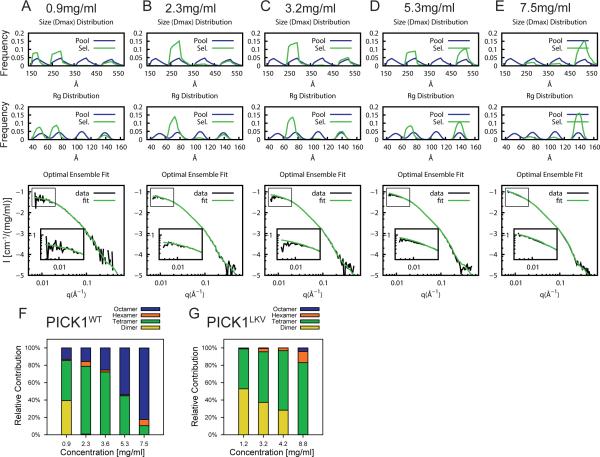
Figure 9. Concentration dependent oligomerization of PICK1WT.
EOM on PICK1WT at increasing protein concentrations; (A) 0.9 mg/ml (B) 2.3 mg/ml (C) 3.2 mg/ml (D) 5.3 mg/ml and (E) 7.5 mg/ml, including dimers, tetramers, hexamers and octamers in the generated pool. Top panels show Dmax and Rg of generated pools in blue and selected pools in green. Bottom panels show SAXS data and fit of optimal ensemble. (F) Quantification of the fraction of dimers, tetramers, hexamers and octamers at different concentrations of PICK1WT. (G) Quantification of the fraction of dimers, tetramers, hexamers and octamers at different concentrations of PICK1LKV from analysis repeated with all species (see Figure S5 for analysis).

