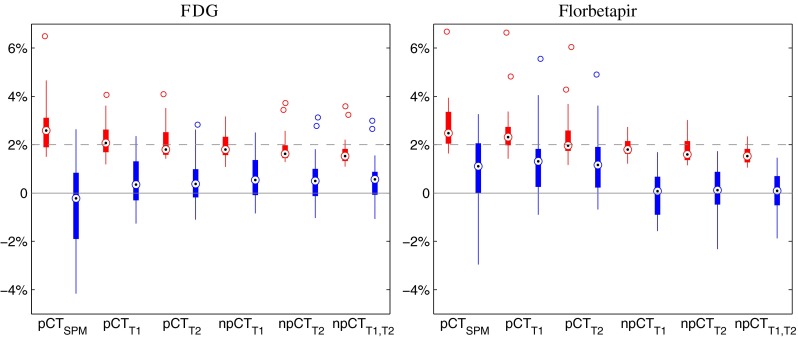
Fig. 3.

Boxplots displaying the median, lower and upper quartiles, minimum, maximum and outliers of the rMAE (red) and rME (blue) calculated between the reference PETs and the PETs corrected with the synthetic μ-maps, in the brain region for both tracers
