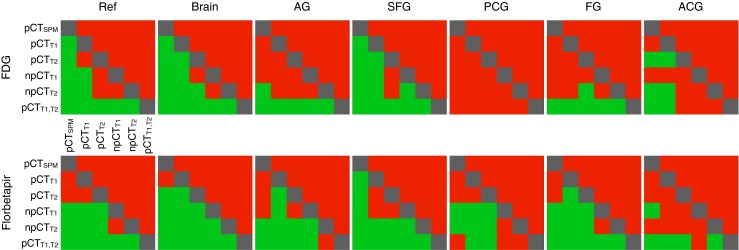
Fig. 4.

Results of the one-tailed Wilcoxon signed-rank test at the 5% significance level for the rMAE computed between the reference PET and each of the PETs corrected with the pCT μ-maps in the reference regions, the full brain and 5 ROIs. The colour green indicates a significant decrease in rMAE for the row method when compared to the column method, while the red indicates that the difference in rMAE is not significant. Note that, for most ROIs, npCTT1,T2 is significantly better
