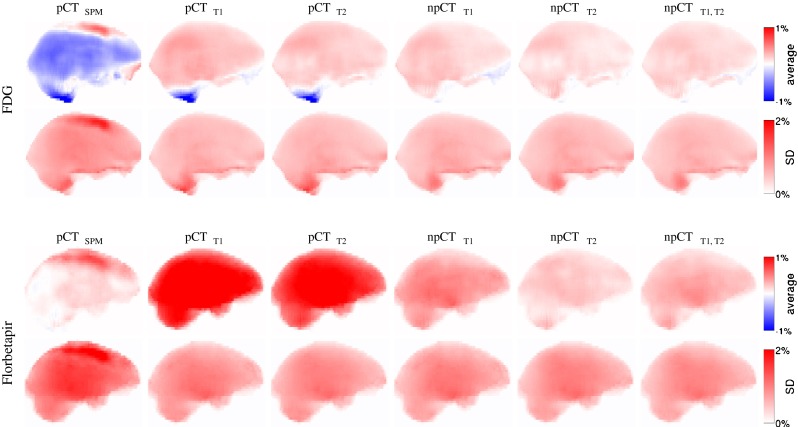
Fig. 6.

Mean intensity projection of the average and SD over 22 subjects of the difference maps. The difference maps were computed between the normalised 18F-FDG (top) and 18F-florbetapir (bottom) reference PETs and the PETs corrected with the synthetic μ-maps
