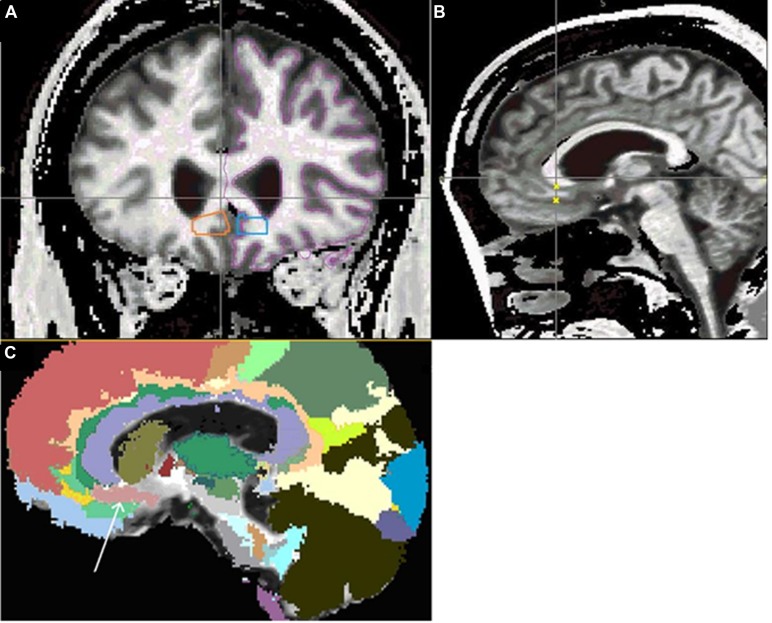
FIGURE 1.
Segmentation of vAC via manual traces integrated into automated atlas. (A) Demonstrates manual vAC traces in orange and blue. The magenta outline demonstrates the extent of the white matter mask. (B) Shows small yellow x marks on the vertical crosshair to indicate where the orange trace intersects with the sagittal plane shown. ROIs are inclusive of gray matter which is excluded via the application of the white matter mask (shown in purple on left hemisphere of coronal image) prior to FA calculation. (C) Shows sagittal slice with Mori atlas label map overlay, showing the extent of the masked vAC region of interest (peach area below the violet genu of the corpus callosum), indicated by the white arrow.

