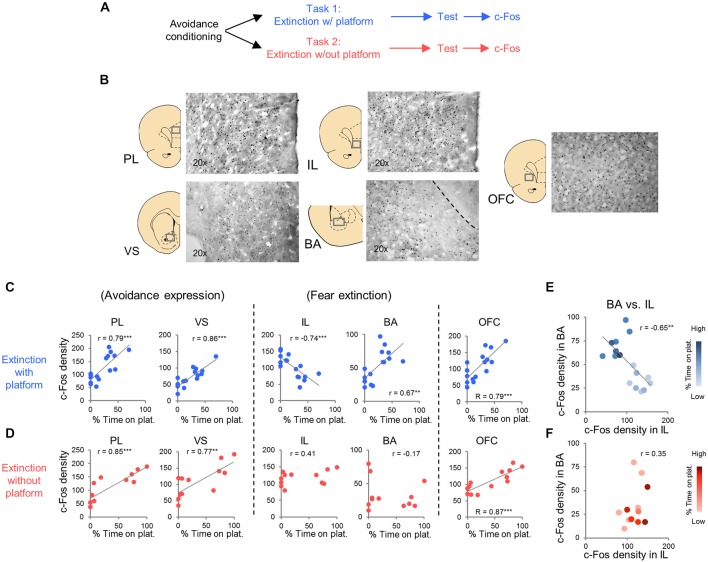
Figure 3.
c-Fos expression at post-extinction avoidance test. (A) Schematic showing experimental protocol. (B) Representative micrographs of c-Fos immuno-labeling. (C) Task 1 revealed positive correlations between avoidance expression at test and c-Fos density in PL, ventral striatum (VS), basal amygdala (BA), and OFC, and a negative correlation in IL (correlation value in inset). (D) Task 2 revealed positive correlations in PL, VS and OFC only. (E) Comparison of c-Fos density in BA and IL in Task 1. (F) Comparison of c-Fos density in BA and IL in Task 2. Darker hues represent higher avoidance whereas lighter hues represent lower avoidance. ***p < 0.001 and **p < 0.01.

