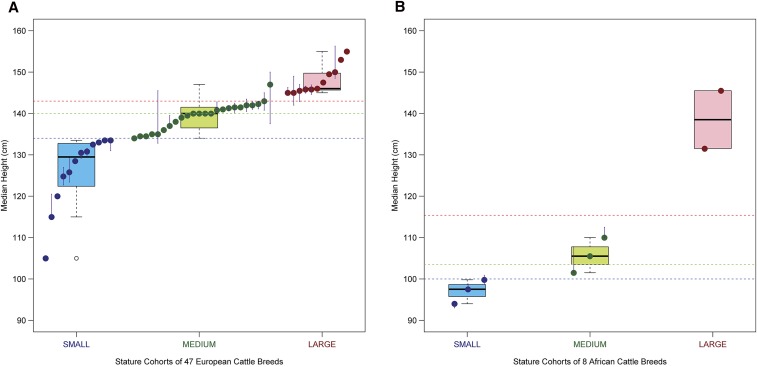
Figure 1.
Distribution of the wither height (cm) of the 47 European (A) and eight African (B) Bos taurus breeds. Each colored dot represents the median of a breed’s stature using FAO data from the multiple countries and the vertical error bars range between the upper and lower quartiles. Several breeds are represented from a single country; therefore, they do not have error bars. The horizontal dashed red, green, and blue lines, respectively, represent the overall upper quartile, median, and lower quartile of all breeds’ data. The red, green, and blue dots represent cattle breeds categorized in the large, medium, and small stature cohorts, respectively (see Figure S1). Boxplots show distribution of breed median data for stature within each cohort.

