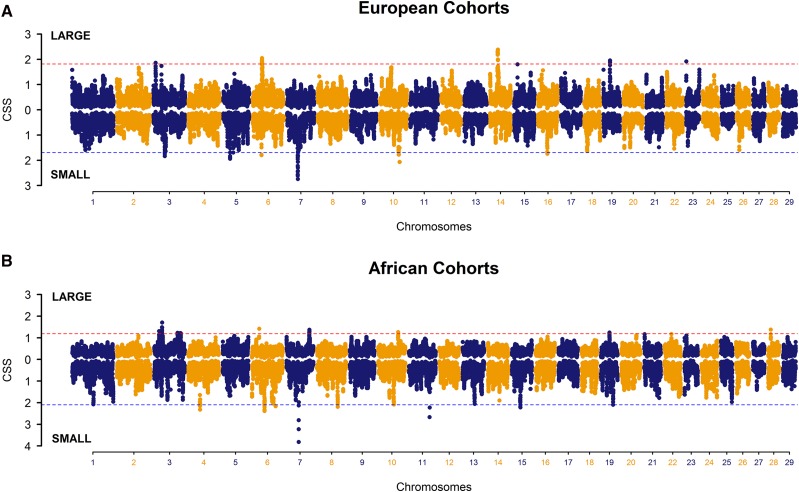
Figure 2.
Manhattan plots of genome-wide (smoothed) composite selection signals (CSS) in the large and small cohorts of (A) European and (B) African breeds. Each cohort was compared against the other as a reference population, as shown in each Manhattan plot for positive and negative CSS scores above or below the dashed lines. Dashed lines (red for positive CSS and blue for negative CSS) indicate the cut-off at the top 0.1% of the genome-wide smoothed CSS distribution.

