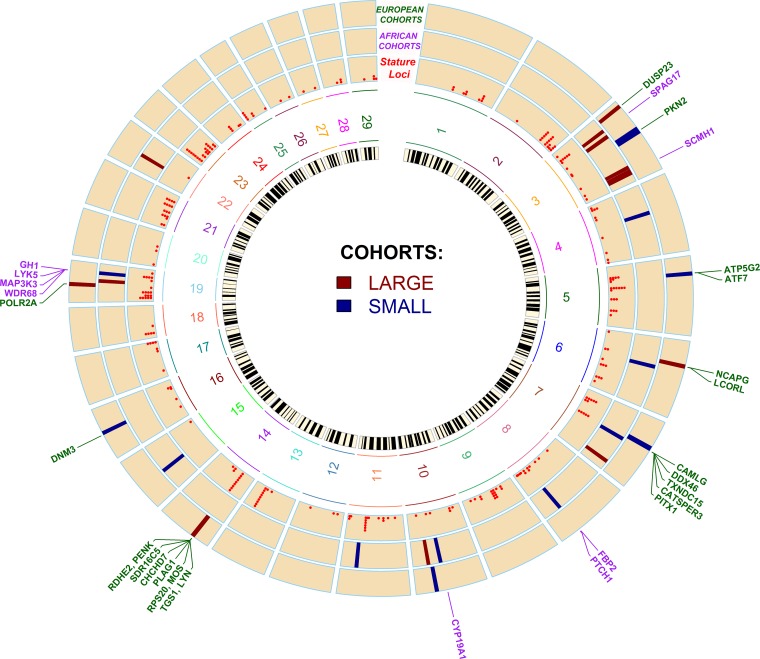
Figure 4.
Circos image showing localization of genome-wide significant regions and candidate genes across all cohorts. The inner circle shows a bovine chromosome (29 autosomes) ideogram. The first outer circle, labeled as Stature Loci, shows the location of 134 loci listed in Table S4, and each red dot represents a stature-associated candidate gene (clustered red dots, within a locus, located on top of each other represent multiple neighboring candidate genes implicated in the same or different GWAS studies). Two circles, in the middle, labeled as EUROPEAN COHORTS and AFRICAN COHORTS show cohort-wise genomic regions identified by top 0.1% CSS (legends in the center for cohort-wise colored bars). The outer track shows genomic locations of 30 candidate genes within the 12 significant signatures of selection linked to bovine stature. Gene colors indicate whether they were identified in European (green) or African (purple) cattle types.

