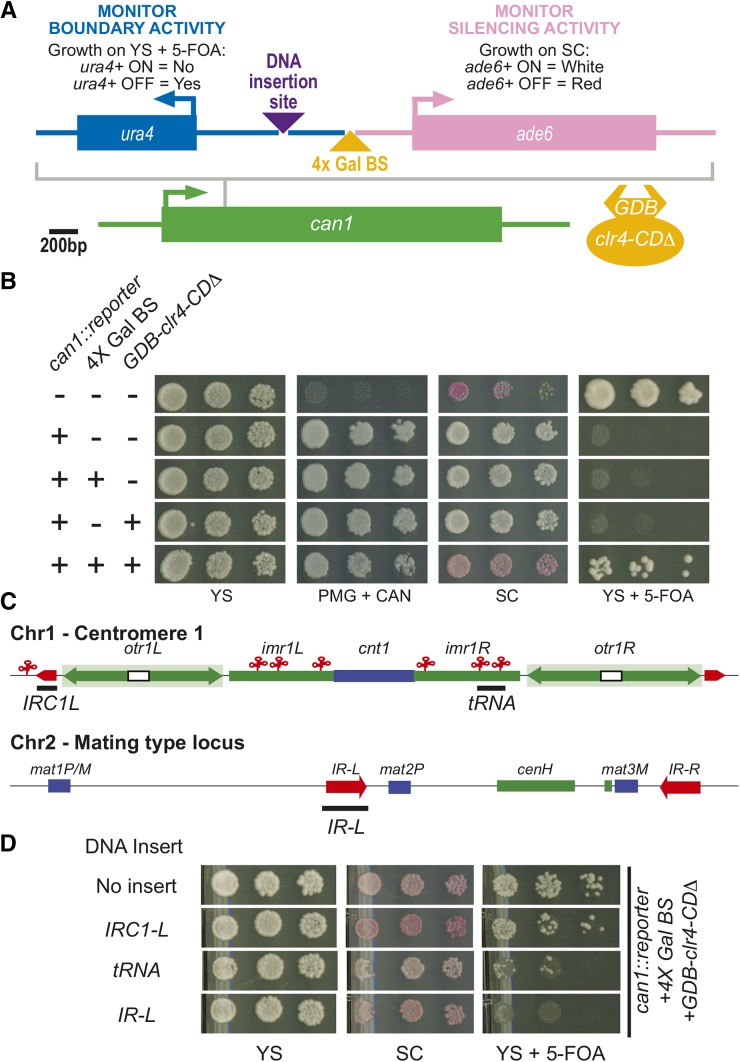
Figure 1.
The transfer RNA gene cluster and IR-L promote boundary activity in a synthetic boundary reporter. (A) Scaled schematic depicting the setup of the reporter construct that was inserted into the can1+ locus. Arrows depict the direction of transcription. Purple triangle represents the DNA insertion site for boundary elements to be tested. The yellow triangle indicates the site where the 4× Gal binding sites are inserted, allowing the recruitment of GBD-Clr4-CDΔ. (B) Plate growth assays on various media. Yeast are pinned onto plates with fivefold dilutions from OD600 = 0.6 culture. YS, rich media; SC, low adenine media (reads out the expression of the ade6+ reporter gene); YS + 5-FOA, rich media containing the drug 5-FOA (assesses expression of the ura4+ reporter gene); PMG + CAN, a minimal media that contains the drug canavanine (reads out the presence of the reporter in the can1+ locus). “+” denotes the presence of a construct in the strain analyzed. (C) A schematic depicting two major regions of S. pombe heterochromatin, centromere 1 and silent mating type locus on chromosome 2. Red elements depict known boundary elements. Blue elements represent genes while green elements indicate heterochromatic sequences. The black bars describe the regions of the DNA analyzed. (D) Plating growth assays of the reporter strain with three different boundary elements (depicted by black bars in C) inserted into the DNA insertion site with the heterochromatin facing side of the boundary element adjacent to the 4× Gal BS.

