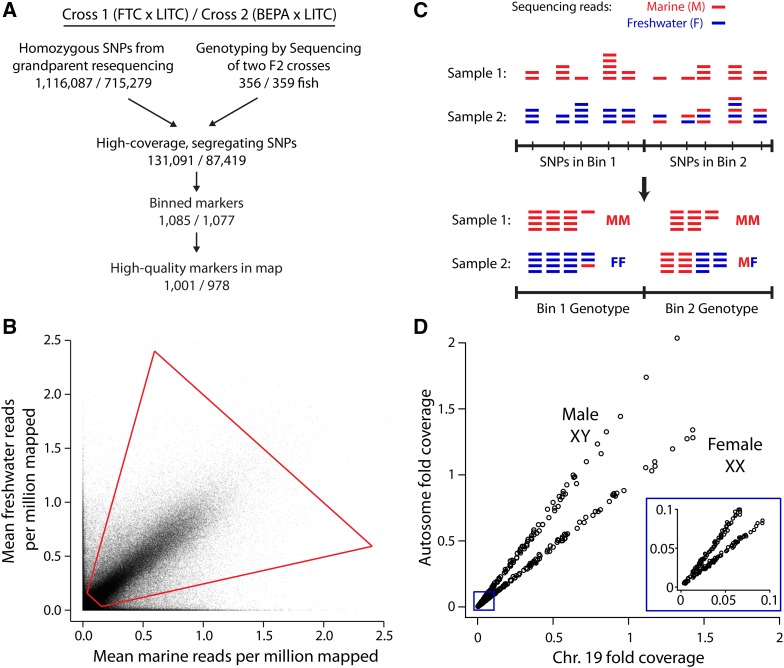
Figure 1.
Genotyping-by-sequencing (GBS) approach. (A) Flowchart of GBS. For each cross, the two grandparents were resequenced to determine homozygous SNP differences, which were filtered for high coverage levels and expected allele ratios in F2s (see Materials and Methods). (B) Sieve for high-coverage, segregating SNPs. For each SNP, the mean number of mapped reads supporting the marine and freshwater alleles, normalized for the number of millions of reads mapped per sample, is displayed. Data are shown for the FTC × LITC cross. Sieve is shown with red quadrilateral: freshwater allele frequency between 0.2 and 0.8 and total coverage between 0.2 and 3. (C) Diagram of binning approach. Low-coverage sequencing generated read pileup at a large number of SNPs. For each F2, SNPs were binned by counting the total number of marine and freshwater reads within the bin and determining a genotype from the pooled counts. Sample 2 illustrates a case in which a recombination breakpoint is near the boundary between two bins and Bin 1 containing the breakpoint is considered to have the FF genotype. Alternatively, bins containing recombination breakpoints also frequently were called with uncertain MF/FF or MM/MF genotypes (Figure S2). (D) Calling sex from sex chromosome (chromosome 19) coverage. Females (XX) have approximately equal sex chromosome and autosome coverage levels, whereas males (XY) have approximately half the coverage level on the sex chromosome compared to the autosomes. Data are shown for the FTC cross. Inset shows zoom-in of low-coverage samples showing that female and male fish can still be distinguished.

