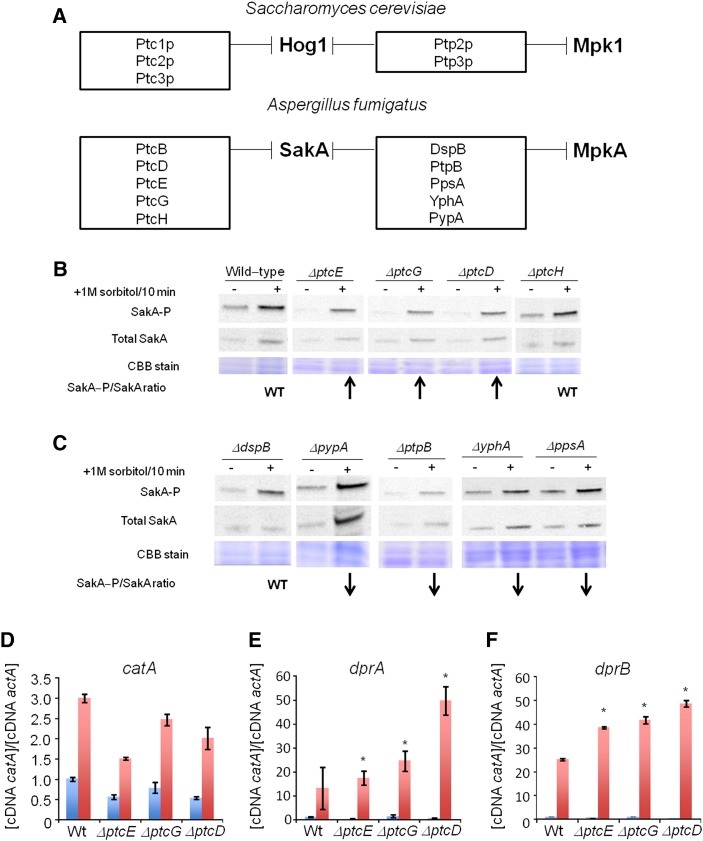
Figure 3.
Identification of putative SakA phosphatase null mutants with increased SakA phosphorylation. (A) The putative A. fumigatus SakA and dual SakA/MpkA phosphatase homologs. Upper panel shows the S. cerevisiae Hog1p and dual Hog1p/Mpk1 phosphatases and the lower panel shows the putative A. fumigatus SakA and dual SakA/MpkA phosphatases. These data were based on the phylogenetic analysis shown in Figure S2. (B) and (C) Immunoblot analysis for SakA phosphorylation in response to osmotic stress. The wild-type and the phosphatase null mutants were grown for 18 hr at 37°. Then, sorbitol (1 M final concentration) was not added (control) or added for 10 min. The mycelium was harvested at the indicated times, and total proteins were extracted. Anti-phospho-p38 was used to detect the phosphorylation of SakA, and anti-Hog1p was used to detect the total SakA protein. A Coomassie Brilliant Blue (CBB)-stained gel is shown as a loading control for both gels. Signal intensities were quantified using the Image J software by dividing the intensity of SakA-P/SakA ratio. The experiment was repeated at least three times and a representative blot is shown. The “WT” signifies that the levels of SakA-P/total SakA on osmostress were similar to wild-type, whereas the arrows ↑ and ↓ that correspond to the levels of SakA-P/total SakA on osmostress were higher or lower than the wild-type, respectively. Phosphatase null mutants show higher expression of osmostress-dependent genes. The wild-type and the phosphatase null mutants were grown for 18 hr at 37°. Then, sorbitol (1 M final concentration) was added for 0 (control) and 10 min. The mycelium was harvested at the indicated times, and total RNA was extracted. The relative expression ratios of catA (D), dprA (E), and dprB (F) and actA (Afu6g04740, encoding the actin) were calculated by the ΔCt method. The results are the means (± SD) of three biological replicates (*P < 0.001, comparison of the treatments with the time zero control).

