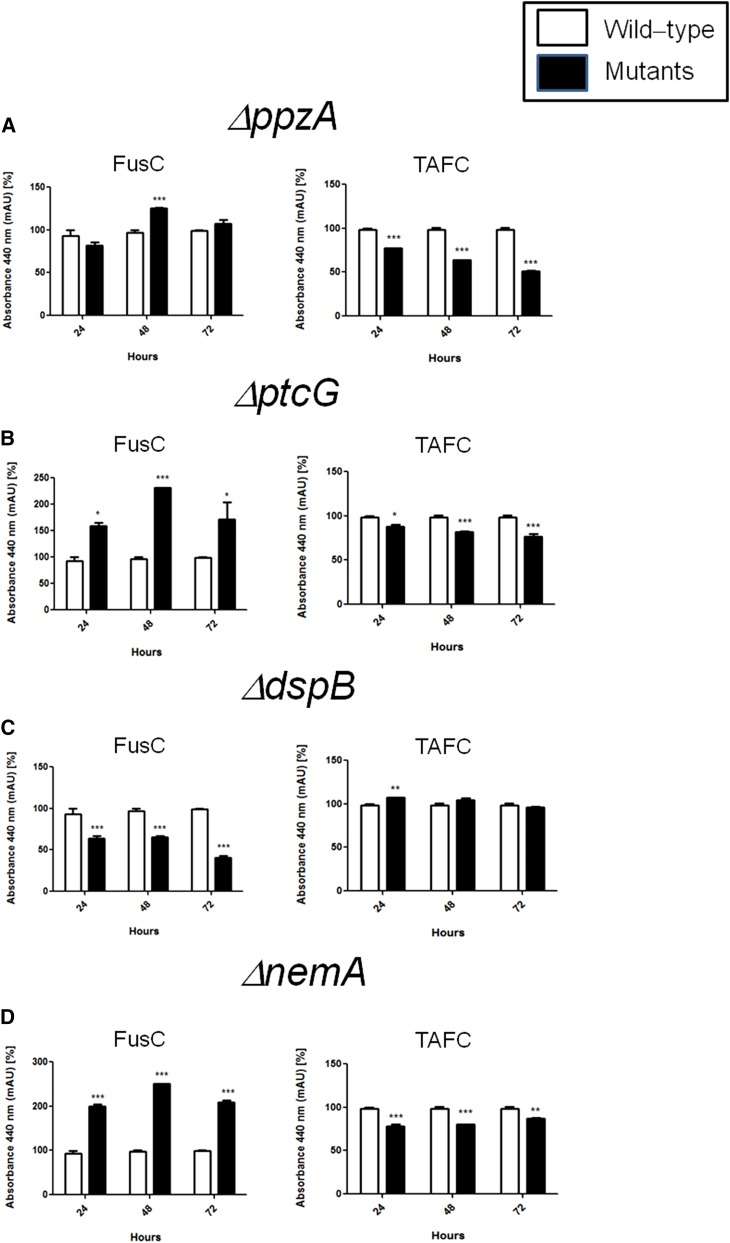
Figure 6.
FusC and TAFC production in the wild-type and phosphatase null mutants that have reduced growth during iron starvation. The bars represent the integration areas of the FusC and TAFC peaks identified from culture supernatants analyzed by RP-HPLC (reverse-phase high-performance liquid chromatography). *P < 0.05; **P < 0.01; and ***P < 0.001.

