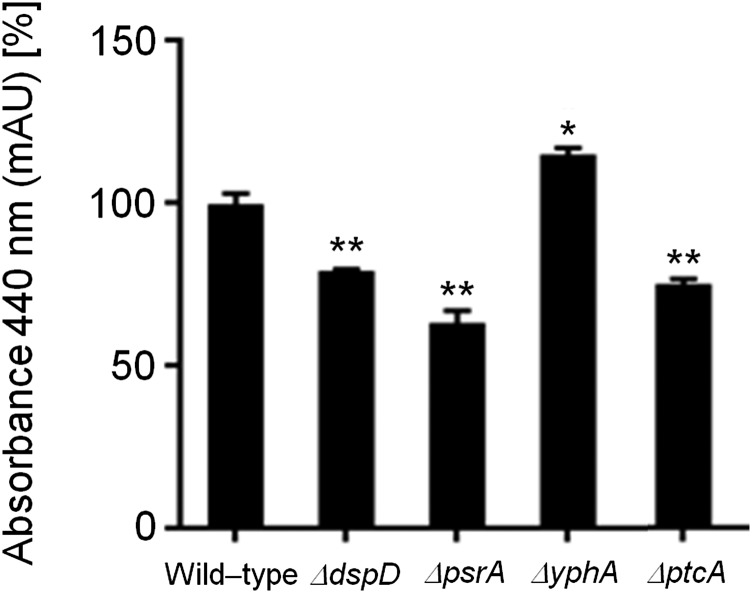
Figure 8.
Ferricrocin (FC) production in the wild-type and phosphatase null mutants that have increased growth during iron excess. The bars represent the integration areas of the FC peaks identified from culture supernatants analyzed by RP-HPLC (reverse-phase high-performance liquid chromatography). The asterisks indicate statistical analysis using unpaired t-test (*P < 0.05 and **P < 0.01 when compared to the wild-type strain).

