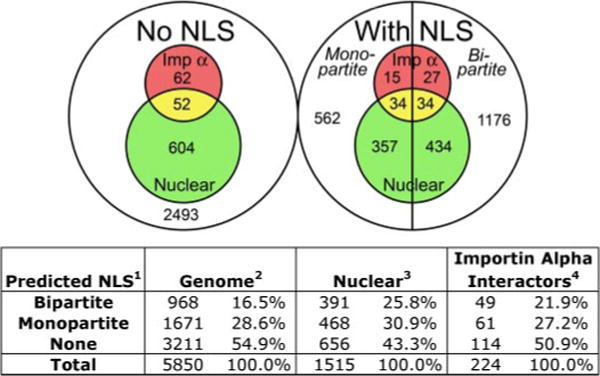
FIGURE 3. The prevalence of classical nuclear import.

The PSORT II algorithm for monopartite and bipartite cNLSs was used to query three data sets: the 5850 proteins in the S. cerevisiae GenBank™ (Genome) (55), the 1515 proteins localized to either the nucleus or the nucleolus in the global yeast GFP-fusion library (Nuclear, green) (56), and the 224 proteins that interact with importin α according to the BioGRID data base (Importin Alpha Interactors, red) (57). The Venn diagram indicates the number of proteins from each data set with no predicted cNLS (left circle) or with a monopartite or bipartite cNLS (right circle). The corresponding percentages are listed in the table below.
