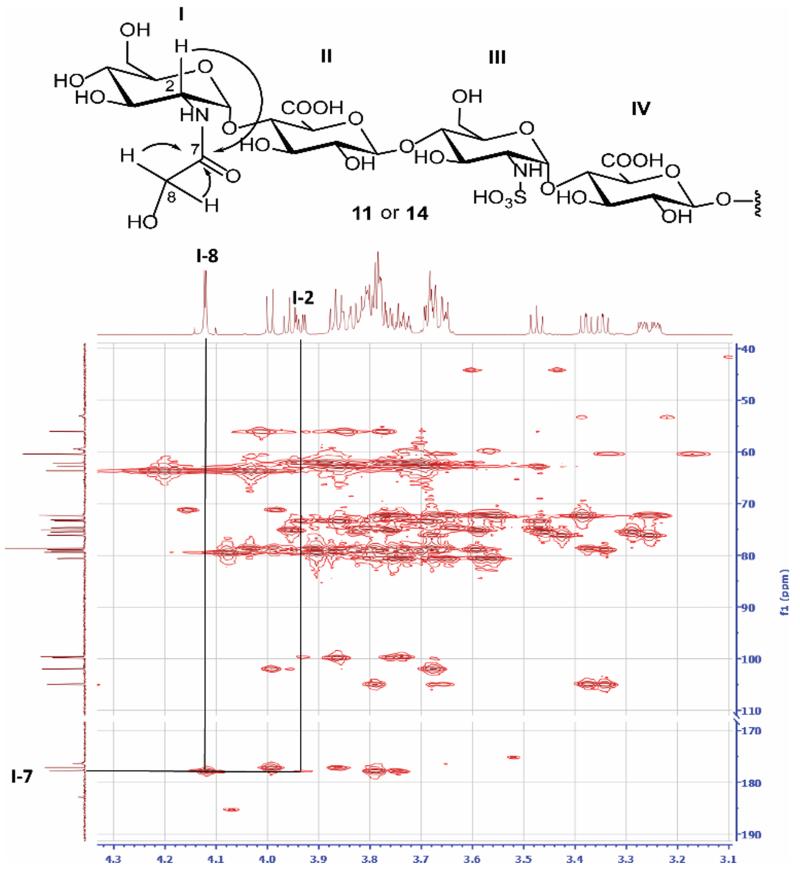
Fig 2.
1H-13C HMBC key correlations of 11. The signals of featured groups are indicated. The cross peaks are connected with arrowed lines identifying correlated carbon and proton. The corresponding chemical structure is shown on top of each spectrum. The anticipated correlations are indicated in the structures by curved arrows.

