
Fig. 2.
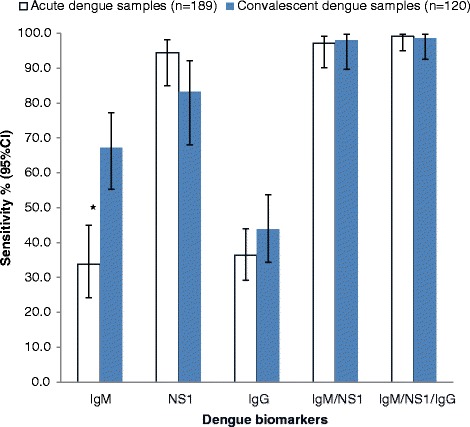
Sensitivity of SDB DD ICT according to sample collection phase. Data represent sensitivity (%) and error bars represent 95 % CI. *indicates significance at the p < 0.001 level when comparing acute and convalescent dengue samples
Official websites use .gov
A
.gov website belongs to an official
government organization in the United States.
Secure .gov websites use HTTPS
A lock (
) or https:// means you've safely
connected to the .gov website. Share sensitive
information only on official, secure websites.
Sensitivity of SDB DD ICT according to sample collection phase. Data represent sensitivity (%) and error bars represent 95 % CI. *indicates significance at the p < 0.001 level when comparing acute and convalescent dengue samples