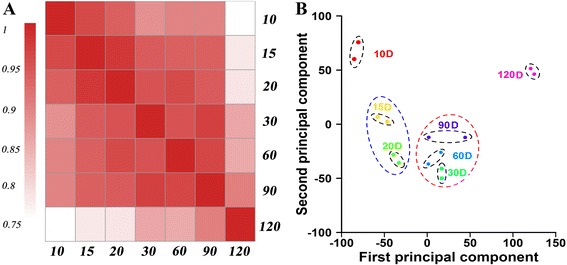
Fig. 2.

Correlation of gene expression levels between stages and PCA analysis of all arrays. a Correlation of gene expression levels between stages. Each developmental stage is most highly correlated with its adjacent stage. a decrease in correlation is observable as the root stage pairs became more distant to each other developmentally. b PCA analysis of the seven sweetpotato root developmental stages with two biological replicates. All the two biological replicates of seven samples were excellently assigned together, and four clusters sharing similar expression signatures were identified. D represents days after transplanting
