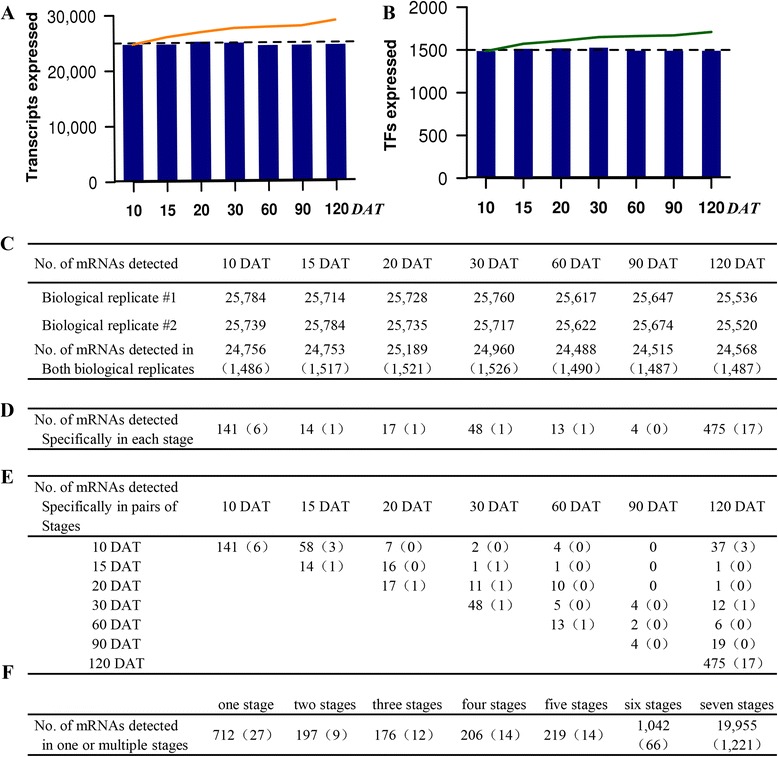
Fig. 3.

Genes expressed during sweetpotato root development. a Transcripts expressed (e.g., P and P in both biological replicates). The bar graphs indicate the number of transcripts expressed in each sample; the lines indicate the cumulative number of expressed transcripts. b Transcription factors (TFs) expressed. The bar graphs indicate the number of transcription factors expressed in each sample; the lines indicate the cumulative number of expressed transcription factors. c Number of transcripts expressed at each stage of development. Numbers for biological replicates 1 and 2 indicate the number of probes with a detection call of P in each experiment. The number for both biological replicates indicates a consensus probe set detection call of PP. d-f Number of specific and shared genes expressed at developmental stage. Number in parentheses indicates TFs
