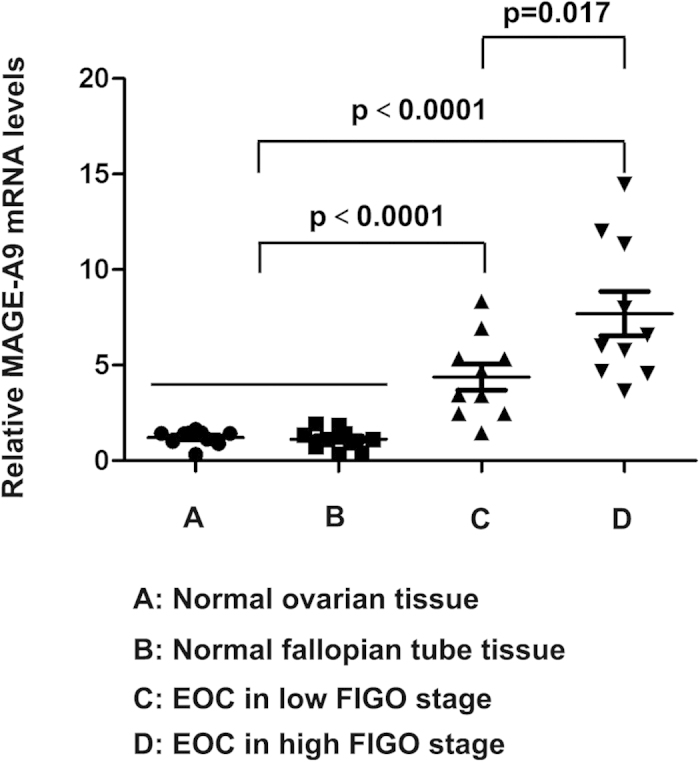
Figure 1. MAGE-A9 mRNA expression in EOC tissues and normal tissues.

Real-time PCR demonstrated that the expression of MAGE-A9 mRNA in high FIGO stage, low FIGO stage, normal ovary and normal fallopian tube tissue were 7.63 ± 0.503, 4.13 ± 0.284, 1.03 ± 0.128 and 1.475 ± 0.093 respectively. The expression of MAGE-A9 mRNA in ovarian cancer samples was significantly higher than in noncancerous tissues (all P < 0.05).
