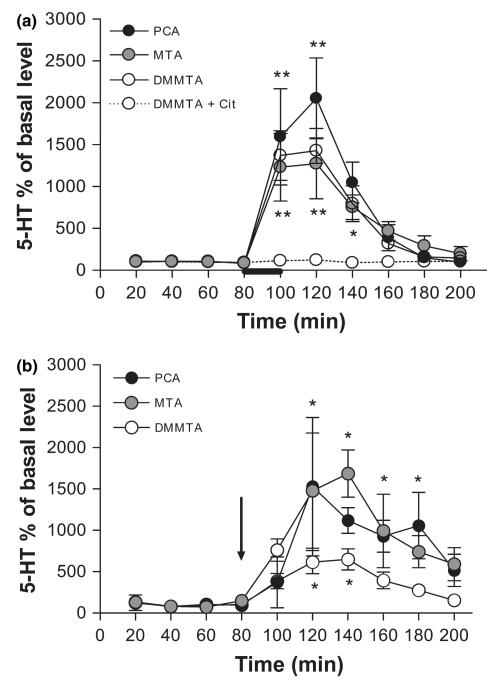
Fig. 8.
Microdialysis data showing the effects of DMMTA, MTA or pCA either applied locally (panel a, drugs infused at a concentration of 1 mM as indicated by the bar) or given systemically (panel b, i.p. injection of 5 mg/kg is indicated by the arrow) on extracellular 5-HT in the rat lateral septum (LS) and in the dorsal hippocampus. Data are mean ± SEM (n = 4–6 for each condition). Asterisks indicate a significant difference between samples after treatment and the corresponding basal values, calculated by one-way anova-Student–Newman–Keuls: *p < 0.05, and **p < 0.01.

