
Fig. 4.
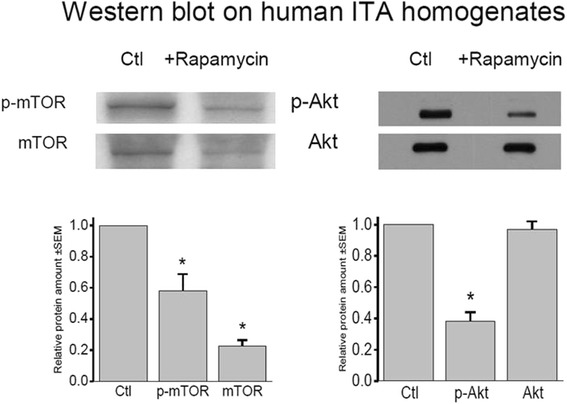
Left-hand traces. Top: Representative Western blot bands for phospho (Ser 2481)-mTOR (p-mTOR) and mTOR (anti-c-terminal antibody) on internal thoracic artery tissue. Bottom: Columns indicate repression of p-mTOR and mTOR on ITA tissue exposed for 20 h to 1 μM rapamycin in relation to controls (Ctl). Asterisk indicates statistical significance for down-regulation. Each test was performed and normalized in six experiments, and the bars represent SEM. Right-hand traces. Top: Representative Western blot bands for phospho (Ser 473)-Akt (p-Akt) and Akt on internal thoracic artery tissue. Bottom: Columns indicate changes of p-Akt (n = 24) and Akt (n = 19) in ITA tissue exposed for 20 h to 1 μM rapamycin in relation to controls (Ctl). Asterisk indicates statistical significance for down-regulation, and the bars represent SEM