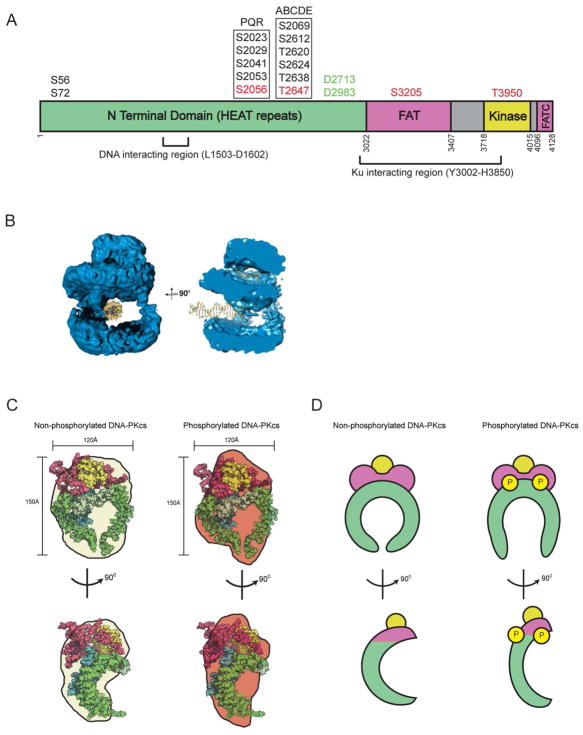
Figure 2. Structure of DNA-PKcs.
A. Cartoon of architecture of DNA-PKcs showing the N terminal HEAT repeat region (green), and the FAT and FAT-C domains (magenta) that flank the kinase domain (yellow). The major in vivo phosphorylation sites discussed in this review are indicated above the figure and the domain boundaries by the numbers below. See also (Dobbs et al., 2010). Mitotic phosphorylation sites (indicated in red) are from (Douglas et al., 2014) and (Lee et al., 2011). The region of DNA-PKcs implicated in interaction with Ku and DNA are from (Jin et al., 1997) and (Gupta and Meek, 2005), respectively. Also shown are the caspase cleavage sites (green) reported in (Song et al., 1996).
B. Representation of the cryo-electron microscopy structure of DNA-PKcs from (Williams et al., 2008) showing the potential path of double stranded DNA through the large central cavity, and a model for the single stranded ends of frayed DNA through the putative upper central channel of the DNA-PKcs molecule. On the left, DNA-PKcs is shown with the crown (now known to contain the FAT-kinase and FATC domains) on the top, and the HEAT repeats on the sides, forming the arms that surround the large central cavity. In the representation shown, dsDNA is shown to the left in the central cavity. The structure on the right is rotated by 90°, illustrating the potential path of single stranded DNA into the head domain as suggested in (Williams et al., 2008). This figure is reproduced from (Williams et al., 2008) with permission.
C. Upper two panels: Representations of the crystal structure of DNA-PKcs from (Sibanda et al., 2010) coloured as in panel A (HEAT repeats in green, FAT-kinase and FATC in magenta-yellow-magenta), superimposed on the SAXS envelopes of non-phosphorylated (cream) and autophosphorylated (brown) DNA-PKcs from (Hammel et al., 2010b) and (Dobbs et al., 2010). The lower two panels represent the structures rotated by 90°.
D. Hypothetical models for DNA-PKcs in its non-phosphorylated and autophosphorylated forms. In the lower panel, the hypothetical structures are rotated by 90°. We suggest that autophosphorylation of DNA-PKcs may induce opening of the putative gap at the base of DNA-PKcs, as reported in (Sibanda et al., 2010) (top panels) or a conformational change, perhaps with opening or elongation of the concave surface created by the HEAT domain (lower panels). Colours are as in panel A. See text and (Dobbs et al., 2010; Hammel et al., 2010b) for details.

